
Characteristics of Bull and Bear Markets
Zweig's description of the start of a bull market is very telling on events since March 2009. Zweig says the first rally must have a tremendous surge for a major market advance. It generates more buying enthusiasm and brings in people who missed the first move and reverses the market psychology. So after small setbacks, new buyers enter and there is no sharp correction. “One of the frustrating things for people who miss the first rally in a bull market is that they wait for the big correction and it never comes. The market just keeps climbing and climbing”. Zweig says such a rally typically feeds on itself for six months and can sometimes last longer.
What if scenarios allow an examination of what the Zweig’s model predicts if the Fed takes action to cool the economy down or expand it. In the case of just the Prime or Federal funds rate together with the market reacting badly to this event with a greater than four percent fall in stocks then it could reduce the holding position down to 50%. If the Fed used more than one tool at once it could give a zero signal. Going in the opposite direction according to the model then the Fed can easily counteract a falling market with just one tool and by using more than one at once could lay the foundations for a bull market. If the Fed, was for instance trying to combat rising inflation and further increases in interest rates occurred then the model would soon indicate a sell. If the rise came after a long period and was seen as things returning to a more normal position then the Super Model predicts that a gradual rise in interest rates would only cause a much smaller stutter in the stock market.
Predictive Power
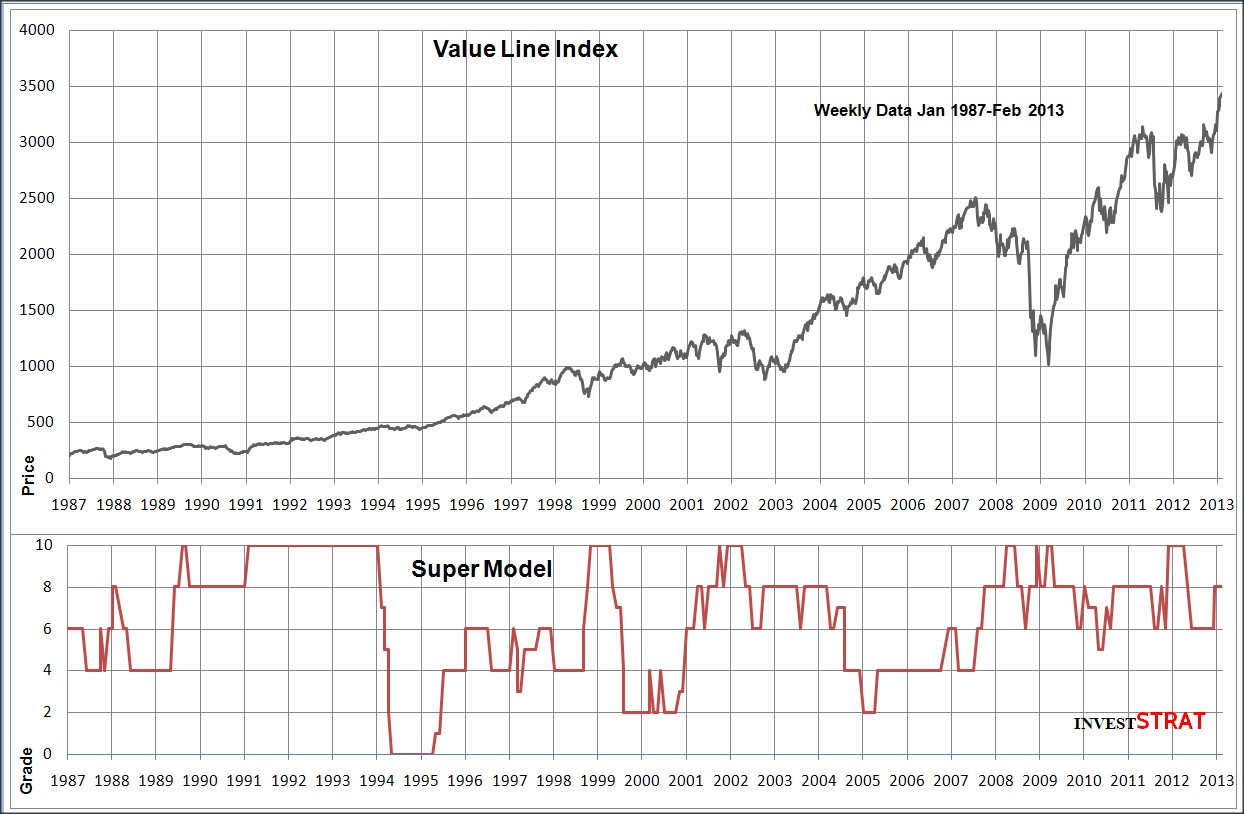
So how does the Super Model do at detecting stock market crashes? For the crash of October 19, 1987, the Super Model did reduce its buy signal to 50% from June of that year. For October, the model gives an 80% buy signal as the Fed adjusted the Federal Funds Rate after the crisis hit. Although the Super Models grade fell in November, there was a recovery from December which the model reflects. This 1987 crash started in Hong Kong and at the time was considered largely to do with irrational fear in the market and programmed selling, things the model should not pick up upon.
The dot-com bubble was enabled by low interest rates causing speculation in technology and internet stocks that peaked on March 10, 2000 when the NASDAQ peaked at 5,048.62, double what it was the year before. The Super Model would have given a signal to sell in September 1999 which lasted until March 2000 when it gave a 50% invest signal, from the Four Percent Model on March 17, 2000 after the bubble had burst on March 10, 2000. The Super Model then gave a sell signal that lasted until November 2000, apart from a small rise above the battlements in June 2000. The model therefore accurately predicted the effect of the Fed rising interest rates six times from 1999. At the time the crash was put down to massive, multi-billion dollar sell orders for major high tech stocks which by chance had been processed at the same time on Monday March 13, 2000 and caused a 4% lowering opening of the NASDAQ. This resulted in a spiral of panic selling by investors. The poor results of internet retailers in the 1999 Christmas season were made public in March when annual and quarterly reports of public firms were released and this showed that the expected high profitability of the dot-coms was not a reality. However, the Super Model clearly shows that economic monetary and momentum conditions were at work.
Between January 1 and October 11, 2008, owners of stocks in US corporations saw their holdings decline in value from around US$20 trillion to US$12 trillion. The head of the International Monetary Fund (IMF) on October 11, 2008, warned that the world financial system was teetering on the “brink of systemic meltdown”. Bank failures occurred in the US, Europe and sharp reductions in the value of equities and commodities occurred worldwide. The failure of all the banks in Iceland threatened the whole country with bankruptcy. Many economists at the time warned that the global financial system was on the brink of collapse which would trigger a recession comparable to that of the Great Depression.
The Super Model gave a fully invested signal throughout 2008 apart from September when Lehman brothers went bankrupt when it fell to 80%. The Super Model clearly failed to pick up on the credit crunch situation let alone its severity. The Four Percent Model which gets its signals from changes in the market was bearish at the beginning of 2008, went bullish at the beginning of April and went bullish again for a short time at the end of October, after the worst of the news was out. At the beginning of November the indicator went bearish again before going bullish once more at the end of November until the end of the year. Even the trend from the Four Percent Model did not accurately represent the severity of the events.
Compared to the severity of the situation some market observers were surprised by how little the US stock market fell and how quickly it rebounded. Did the action by the Fed to lower interest rates to near zero keep the market from a total collapse?
The crisis was triggered like the dot-com crash from low interest rates which feed rising demand for property and housing prices but there was no stock market bubble when the crisis spread to the equity markets. House prices in the US peaked and then started to decline in 2006 and a subprime mortgage crisis became apparent in 2007 as subprime borrowers with weak credit histories and reduced repayment capacity defaulted on their loans. However, the properties that the bank foreclosed upon were now worth less than the loan and were still falling in value. These loans had been securitized and mixed in with more secure property loans and this caused a collapse in securitized mortgages in July 2007. By October 2007, approximately 16% of subprime adjustable rate mortgages (ARM) were either 90-days delinquent or the lender had begun foreclosure proceedings, roughly triple the rate of 2005. By January 2008, the delinquency rate had risen to 21% and by May 2008 it was 25%. As the banks did not know who held good or toxic debt, the banks refused to lend to each other. This resulted in a liquidity crisis or credit crunch with a reduction in the general availability of loans or credit that was clearly independent of a rise in official interest rates.
The Federal Reserve gave conflicting signals in its efforts to avert the crisis, rescuing some institutions such as Federal National Mortgage Association (FNMA) and AIG but letting others such as Lehman Brothers go to the wall on September 15, 2008. The crisis coincided with the Presidential election and no Republican wanted to be seen following such socialist policies as nationalizing a bank in the run up to the election. John McCain’s decision on September 24 to suspend his campaign and sit in on the financial system bailout also helped to slow it down and made it more uncertain.
On September 29, 2008 the Dow Jones industrial average fell nearly 778 points, the biggest single-day point loss ever with a fall of US$1.2 trillion in market value after Congress rejected the government’s US$700 billion bank bailout plan. However, this 7% decline does not rank among the top 10 percentage declines. Beginning October 6, 2008 and lasting all week the Dow Jones Industrial Average closed lower five out of five sessions and was the worst week for the stock market in 75 years. The crashes forced the Fed on October 6, 2008 to provide US$900 billion in short-term cash loans to banks and October 7, 2008 Fed made an emergency move to lend around US$1.3 trillion directly to companies outside the financial sector. The falls were triggered by fear of what could happen to the economy if an economic bailout could not be politically agreed upon rather than monetary economic conditions. The stock market falls in percentage terms were not near the severity experienced during the last stock market crash in 1987. The reason was that the market was not at a high as is the case with conventional stock market crashes that occur after stock market bubbles have developed.
The UK government launched a US$50 billion rescue package on October 8, 2008 that put capital in British banks through a part-nationalization. This event together with the collapse of the US stock market finally pushed through the rescue in Congress and a change in its direction. Treasury Secretary Paulson on November 12, 2008 abandoned the plan to buy toxic assets under the US$700 billion Troubled Asset Relief Program (TARP) and the remaining US$410 billion would be used to recapitalize financial companies.
New Policies and Conditions
 The Zweig model was devised before the special policy of Quantitative Easing (QE) was first used so does not take this policy into account. Quantitative Easing is used when short-term interest rates are at or near zero making conventional monetary policy impossible to carry out. A central bank buys financial assets to inject a pre-determined quantity of money into the economy. This is different from the more usual policy of buying or selling government bonds to keep market interest rates at a specified target value. A central bank implements quantitative easing by purchasing financial assets from banks and other private sector businesses with new electronically created money. This action is meant to work by increasing the excess reserves of the banks and through demand and supply raising the price of the financial assets bought, which are usually short-term government bonds. As the price of these bonds increases their yield falls. The possible problems of QE include the policy being more effective than intended and causing higher inflation, or of not being effective if banks do not lend out the additional reserves. The Central Bank of Japan first used the policy in 2001 during a period of domestic deflation after the Japanese asset price bubble caused a market collapse in the early 1990s and is considered to have been unsuccessful.
In late November 2008, the Fed started what became called QE1 by buying US$600 billion in Mortgage-backed securities (MBS). By March 2009, it held US$1.75 trillion of bank debt, MBS, and Treasury notes, and reached a peak of US$2.1 trillion in June 2010. Further purchases were halted as the economy had started to improve, but resumed in August 2010 with QE2 when the Fed decided the economy was not growing robustly. QE2 ended in June 2011. QE2 was replaced with Operation Twist in September 2011 with the purchase of US$400 billion of bonds with maturities of 6 to 30 years and to sell bonds with maturities less than 3 years. Operation Twist ran until June 2012. This policy was extended in July 2012 to buy Treasuries with the purchase of US$267 billion maturities of six to 30 years, while selling those with durations of three years or less and ran until December 2012.
QE3 was announced on September 13, 2012. This was described as ‘Unlimited QE’ as it was an opened ended bond purchasing program of US$40 billion per month of mortgage-backed securities which aimed to lower long-term interest rates, stoke consumer demand until there was a substantial improvement in unemployment. This was different from the first two policy rounds which had a set total amount for buying. At the same time the Fed announced that interest rates would be kept between 0-0.25%, until mid-2015. On February 20, 2013, there was dissention from “a number” of the Federal Open Market Committee (FOMC) who were worried that the costs of QE might start to outweigh the benefits as the Fed buys securities at a pace of US$85 billion a month.
Operation Twist involved selling short-term bonds, while purchasing longer-term securities and works by twisting the yield curve relationship between the maturity and the interest rate. It is seen as a less extreme policy step than outright purchases of new securities. The policy intent is to push down the long-term eight to ten-year interest rates, but the other effect on the other side of the twist is to push up one to two-year interest rates. Operation Twist is based on the idea that eight and ten-year rates for costs are tied to mortgages and are more important than the one or two-year rates which tend to be tied more to short-term business loans. The Twist policy was first used in 1961 when the twist dance was popular and was not considered to have been particular successful at the time.
An alternative model that also measures QE and Operation Twist is included to improve its completeness but the original model already gives a maximum buy signal when interest rates are near zero and so the adjusted model gives only a third weighting to the ‘Fed Indicator’. As far as the Zweig Model is concerned any effect on the stock market from QE3 ended in September 2013, although its effect on the real economy may well continue.
The Super Model did not predict the Financial Crisis of 2008/2009 as it concentrates on interest rates although this factor explains the rapid recovery of the US stock market. A market timing model that could deal with such conditions would need to include indicators based on house prices, political stability and the TED spread between the interest rates on interbank loans and short-term US government debt. The TED spread is an indicator of perceived credit risk in the general economy. However, without testing it is unclear if such measures do relate directly to US stock market behavior except perhaps during the period of this special crisis.
If you missed out on the bottom of the market consider this Zweig quote. “People somehow think you must buy at the bottom and sell at the top to be successful in the market. That's nonsense. The idea is to buy when the probability is greatest that the market is going to advance”. The market nervousness before the meeting of the Federal Reserve at the end of September 2009, to decide if interest rates needed changing clearly demonstrates that the monetary factors in Zweig’s model are still relevant and important.
Prime Rate Indicator