
Intro
This is part independent white paper, review, and educational document into how to create stock screens using the Screener.co tool. Screener.co is a powerful do-it-yourself stock screening tool.
Most beginner investors gravitate towards story stocks that have little in the way of financial fundamentals to support their price rise. They also make their share selections based on tips often from a share tip magazine or service. These tips are open to abuse and you could be buying some tipped share that an institutional investor is desperate to exit their large position or a share that could rise very dramatically and make the tipping service look very clever but the chance of that actually happening is very slim. They do not have a strategy to buy shares that have a certain set of attributes that are likely to make these shares rise in value. Stock screening involves searching for companies that meet specific financial criteria and so uses a strategy to determine what to search for.
Individual investors could decide to select shares that appear to be undervalued or companies undergoing high growth that are likely to become larger and more valuable. Even traders who are more interested in the trend of a share often narrow down their initial search by looking for companies with certain fundamental attributes.
Joel Greenblatt is one of the world’s greatest professional investors and he wrote The Little Book That Beats the Market in 2006, aimed at giving individual investors a relatively simple quantitative formula to pick shares. This has led to increased sophistication in how individual investors screen for stocks and these new ratios and techniques do not just look for value but combine it with quality and growth factors.
The latest ideas and techniques of other professional investors and academics have trickled down to individual investors and stock screening services have met this demand by supplying the tools and screens to make individual investors almost on a par with a Wall Street Quant. If one group of shares with an attribute such as growth is currently outperforming the other groups an individual investor by using a stock screening service can make themselves instantly into a skilled growth or value investor and so become an investor for all seasons.
Most screening services have a number of screens that are ready created and a few of these services may give you a limited set of the tools these screens were created with for you to make your own. Screener.co is different because it is an advanced set of tools to screen stocks and comes with a readymade few screens.
The vast majority of screens based on investment books can be created without using an algorithmic function in the Create Free Form Condition box. The power of creating Free Form conditions means that you can use Screener.co to create some bespoke screens that few other screening services can create. Some example bespoke screens created in this paper include a PBGY ratio screen, a Buffett style screen with a complex long-term free cash flow on assets condition and alternative or variations of the Magic Formula. Screener has some omissions in its tools but no screening tool or service on the market for individual investors can create all possible screens and their variants. Some basic screens can be created with little prior knowledge but using the Create Free Form Condition is much more complex.
Screener.co was created and is run by Lenny Grover. Lenny worked in venture capital, contributed to Seeking Alpha, and wrote a book on Investing. He also graduated with a computer science degree from Cornell. Risk/Upside Analysis: A Framework for Making Profitable Investment Decisions by Lenny Grover (2014) introduces investment and covers portfolio management from a practical point of view. The book briefly touches on how to use financial ratios that use items on financial statements and explains why these ratios do not always give you the full picture of what is actually happening. It is an easy read for a finance book. Lenny certainly knows his stuff about stock screening.
Finding information
The search box on the front page of the Screener.co will give information about data items in the Screener including the Thomson-Reuters definition and forum posts. I looked up the data item for “P/E Normalized-most recent fiscal year”. There are a number of different P/Es that can be used in a screen, which could cause confusion and mistakes.

The answer you get is “This is the Current Price divided by the latest annual Normalized Earnings Per Share value.” A look on Investopedia might help with the definition. I am not sure that beginners to stock screening and the financial Statement will immediately understand the difference between this P/E and the others and what it should be used to do.

Setting the Exchange
Screener.co allows you to screen across 120 stock exchanges with strong company coverage, is updated daily, and comes with all this information at a very reasonable price even if you just want to screen on your country’s home exchange or exchanges.
The first thing that needs to be done is to choose which exchanges will go in your global set that will allow you to screen for companies that are listed on them. In a screen, you can then rule in or out a country to screen upon. If you add in all the exchanges in the world, you will find shares that you will not be able to trade. This is frustrating and a waste of time. For the US, which has more than one exchange you could set the country to the US and then rule out OTC companies with the OTC control.
Thomson Reuters may be the best data source for company information but how it organizes it by stock exchange can be frustrating. Thomson Reuters lumps together the UK’s main London Stock Exchange (LSE), Alternative Investment Market (AIM), and OTC shares, which most brokers will not allow you to trade upon. Ruling out AIM or OTC shares from your screens is problematic. Many OTC companies are large Russian companies. Having many OTC companies appear in your UK value screens could become frustrating. You could rule them out by disallowing companies located in Russia. The LSE exchange is a very international market you could not simply rule out shares of companies located outside the UK. Setting the market capitalization to find medium sized companies and above would help rule out small AIM stocks. The German market has many regional exchanges but without a specialist broker you will probably only be able to trade on the main Xetra exchange. You can simply not include these small regional exchanges in your global set. Their other examples in Europe where small exchanges in one country have being combined together by Thomson Reuters but you may only be able trade on one of them.
By using some thought, you can get around these problems and use different screens to capture small companies in your home country and larger companies using the global control to set exchanges. Most of these problems are caused by Thompson Reuters and appear in all screeners based upon their data to some degree.
You cannot save a screen one with the same name, making minor edits a chore. I suggest you use version numbers and delete older versions when you are finished.
Creating a Simple Screen
I was able to create a screen using the standard screening tool without any custom functions based on the description in Martin Zweig’s (1997) “Winning on Wall Street”. This follows a Growth at a Reasonable Price (GARP) Strategy. This appears in many screeners such as the American Association of Individual Investors as a ready created screen and has proved to be very successful over a long period.
Screens are created from lines that rule in or out companies that have a certain characteristic. You can copy the line into the Create Free Form Condition box or look up each item and set the input from the pull down list set a relationship such as greater than and the output. It is usual for the first line to set the country or exchange to be screened upon.

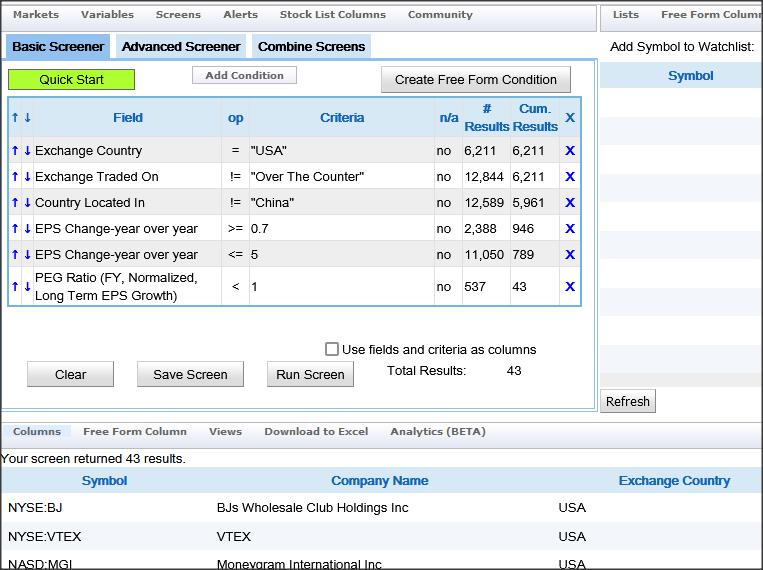
Exchange Country = “USA”
In the center of the screen rules box is the Add Condition control. Press this then choose Descriptive and look in the Security sub list and finally pick Exchange Country we want to set it to the USA, so choose the equals sign and then USA from the list of available countries. All the other lines in the screen are created in the same way as this.
I have set the country to USA, as the US has more than one exchange and you cannot set more than one exchange in a screen without using the markets selection, which is a global control for all your screens.
Exchange Traded != “Over the Counter”
This rules out mainly troubled companies that you would need a specialist broker to trade. This control only works for the USA.
Country Located in != “China”
This prevents companies that are located in China but are traded in the US from appearing in the screen. Some Chinese companies appear to have extremely good financial statement characteristics but are in reality just a vehicle to rip off unwary investors.
Market Capitalization >= 100,000,000
One way to measure, the size of a company is through Market Capitalization. You write out this figure with all the zeros in a million, which is a very small size for a company. This data item appears in the Share related items. Market Capitalization can help determine risk as very small companies are more likely to go bankrupt than large companies. In addition, if you are trading internationally your broker is unlikely to cover very small foreign companies. These can be ruled out by setting Market Capitalization to around the 250,000,000 level.
P/E excluding extraordinary items-TTM >= 5
P/E excluding extraordinary items-TTM <= 42.5
Martin Zweig believed that companies with a P/E below five were high risk. He set the upper value at just above the average P/E for the market. In April 2021, this was about 34 and times it by 1.25, this gives us a figure of 42.5, which will be just above the average P/E. Zweig did not give a specific figure of how much above the average you should go but about 15-25% seems about right. You could calculate a P/E for a set number of markets in the Analytics (beta) tool but they are freely available and I looked up the P/E figure for the MSCI US index. Unfortunately, as this figure cannot be calculated dynamically by Screener.co, you will need to redo this figure in your screen every month.There are various sources on the internet which will give the current P/E for every exchange in the world. MSCI update there figures every month.
Data items such as the P/E that are the most recent fiscal year are not necessarily the most recent for the trailing year. The most recent figure would be the P/E excluding extraordinary items – TTM which is for the Trailing Twelve Months. This is to be found in the Price Related and TTM columns of the screener. For some other data items, the most recent figure would be for the last quarter, as they do not have TTM figures.
EPS Change-year over year >= 0.15
This has Earnings per share growing by at least 15% over the last year. The EPS change Year over year is a percentage figure and we put greater than or equal to 0.15 as a decimal with the digit to the first place. This is the system used in Excel before being converted to a format that shows a percentage sign.
Earnings Before Interest, Taxes, Depreciation+Amortization-3 Year Interim CAGR >= 0.15
This line rules out companies that did not have a growth of at least 15% over the last three years.
Revenue Change-Year over Year >= 0.12
Sales are described as revenue on the financial statement and this is set slightly lower than earnings growth at 12% for the year. This confirms that the company is actually growing its revenue and is largely in line with earnings growth.
Growth rate- Revenue-3 year >= 0.12
This ensures that company’s sales have grown by at least 12% over the past three years.
Price-closing or last bid > Price-200 Day Average
Zweig wanted to see better price action than the company just being above its 200-day moving average. However, it is a good starting point for further research and we have ruled out companies that are below it.
The other factor is directors buying or selling a large quantity of shares in their own company. This information is easily and wisely available for US shares through websites such as http://openinsider.com or https://www.insidermonkey.com.
We have created a relatively complex screen that considers a number of different factors including price action without having to create any free form conditions or use the Advanced Screener. For most investors their screens will fall into this category or will require just one free form condition.
Advanced Screens using Free Form Conditions
Peter Lynch (2000) in his book “One Up on Wall Street” improved upon the P/E ratio with his PEG and PEGY ratios. John Neff (2001) “On Investing” used the same ratio which he called the total return ratio but used an inverse version. The PEG Ratio factors in the projected growth rate of future earnings and the PEGY ratio is a total return ratio, which adjusted the PEG ratio by factoring in dividends, which can be a substantial part of the return for dividend paying stocks. A PEG screen can be created using an existing condition in the screen but for a PEGY screen, a free form condition will have to be created. As available figures for the current dividend per share estimate are often missing screening, using the PEGY ratio will find far fewer companies than the PEG ratio.
PEG ratio = P/E ratio / company's earnings growth rate
If the ratio gives, a result of one it is at par and if under is considered undervalued relative to its growth rate. If the ratio results in a number above one, the ratio says the stock is overvalued relative to its growth rate.
PEGY ratio = P/E ratio / (earnings growth% + dividend yield%)
The PEGY ratio just has the dividend yield added to earnings growth, which is called Total Return.
The PEG Screen and its alternative PEGY are created in the same way as the first Screen we created above. The first three lines of the Screen are the same as the first screen we created that set the country to screen for the US and removes OTC and Chinese companies, many of which give false figures.
Exchange Country = “USA”
Exchange Traded != “Over the Counter”
Country Located in != “China”
Peter Lynch was interested in companies that were growing faster than 7% a year but felt that companies with a growth rate over 50% were growing so fast that they were likely to hit problems and it was best to avoid them.
The next two lines use EPS change Year over Year. This is the Earnings Per share rate over the last year expressed as a percentage growth that Screener.co uses with the decimal point shifted one place to the right just the same as the growth rates in the first screen.
EPS Change-year over year >= 0.7
EPS Change-year over year <= 5
The PEG ratio is chosen from the Shared Variables column item and then PEG. We want to use the PEG Ratio (TTM, Normalized, Long Term EPS Growth) as the PEG Ratio (FY, Normalized, Long term EPS Growth) may not be as up to date. Set the operator to less than 1.
PEG Ratio (TTM, Normalized, Long Term EPS Growth) < 1
The alternative PEGY screen is created in the same way but there is no readymade equation for the PEGY ratio, so we create it using the Create Free Form Condition which is at the top right of the screener instruction box.

We place in the box :-
P/E excluding extraordinary items-TTM / ( Current long term growth of EPS rate + ( Dividend Yield-indicated annual dividend divided by closing price * 100 ) ) < 1
A single space gap is required around the data items and operator signs. Enter what you are looking for in the Create Free Form Condition, which will give you a list of data items to choose from.
You need to tick the box for the side of the equation that the variable or answer you are looking for is on. We do not want companies with missing data so do not tick the box on the left of the pop up to include them. If you do not do this, you will get results that do not have all the necessary information.
We have now created a screen with a bespoke condition using the Free form conditions box.
Normally most of the ratios used are looking in the rear view mirror and we are hoping that this trend will continue. With the forward PEG and PEGY ratio, a forward EPS is used based on consensus analyst forecasts and are only as good as these forecasts.
You could make the mistake of creating the PEG and PEGY ratio with a forward P/E. If this figure is put into the ratio then we looking for companies, which are not just cheap to buy now but are, expected to be cheap in the future.
An Original Bespoke Screen
On the Seeking Alpha site, I found a PBGY ratio also based on Peter Lynch’s PEGY ratio. Although it does not have a track record of success, the author cites a case study by Third Avenue investment analysts, which should make this screen valid.
This screen does not appear as a ready-created screen on any stock screening service. The creation of this screen will demonstrate that Screener.co can be used to create novel screens and allow its users to experiment with new investing techniques. Screening is a practical activity and you may have a ratio that is very rigorous and gives a fresh analytical insight but if the available data means it can only be used on a very limited number of companies then its usefulness is limited.
The PBGY ratio is derived by dividing the P/B ratio by the sum of the long-term per share growth rate and the rate of dividend yield, together these last two items is the rate of total return.
Deep value stocks typically reward their shareholders through mean reversion or the positive re-rating of their P/B multiples. If the deep value stock is delivering decent book value per share growth, it implies the stock's discount to net asset value will widen if the share price remains stagnant (since the denominator of the P/B ratio, book value is growing.) The investment thesis is that the market cannot afford to ignore a stock whose P/B ratio keeps on going lower, while it is profitable and compounding book value over time.
Extending the reasoning behind the PEGY ratio to the PBGY ratio, a stock trading at book value should yield 10% (from a mix of book value growth and dividends) at the minimum. This implies a PBGY ratio of 0.05 will be compelling to investors. The author says that this represents a deep value investment candidate valued by the market at 0.5 times book with a book value per share growth of 5% and a dividend yield of 5%. The author used a PBGY of 0.3 to further narrow candidates but I kept to the theoretical 0.5 level. (The author used historical five-year book value per share CAGR as a proxy for long-term book value growth.)
Market capitalization > 200,000,000
This line, rules out small companies that have higher risk.
This is the PBGY ratio created in the Create Free Form Condition box. The PEGY ratio is calculated by dividing the P/B ratio by the sum of the long-term book value per share growth rate and the dividend yield.
P/B / (growth rate% + dividend yield%)
Long term PBGY
Price to Book-most recent quarter / ( ( EPS growth rate-5 year * 100 ) + ( Dividend Yield-5 Year Average * 100 ) ) < 0.5
Alternative Current PBGY that is future looking (Use only one)
Price to Book-most recent quarter / ( Current long term growth of EPS rate + ( Dividend Yield-indicated annual dividend divided by closing price * 100 ) ) < 0.5
Total debt/total equity-most recent quarter < 1
We are only interested in very low debt companies. The Total debt/total equity-most recent quarter will have a more up to date figure than Total debt/total equity-most recent fiscal year, which is suggested to be used by the screens author.
Price to Book-most recent quarter < 1
This is a check to make sure that only companies that have deep value appear in the screen. The Price to Book-most recent quarter gives a more up to date figure then the Price to Book-most recent fiscal year.
Dividend per share-most recent fiscal year > 0
These are dividend-paying companies.
Buffett Style Long-term Growth and Quality Screen
Warren Buffett is considered the world’s greatest investor. He has not written a book on how he invests but has given clues at his annual shareholder meetings and letters to shareholders. The two main insights into his investment strategy are Robert G. Hagstrom (2013) The Warren Buffett Way and Mary Buffett and David Clark (1999) Buffettology: The Previously Unexplained Techniques That Have Made Warren Buffett the World's Most Famous Investor. When we just had Buffettology things were easy, you just got out your Electronic Calculator with science functions and followed the set rules. With the latter, The New Buffettology (2012) there are all kinds of rules and exceptions to follow and put into a screen. It is no longer good enough to have five years of Return on Equity (ROE) at over 15% but warned that some companies could fool us and we need five years of Return on Capital (ROC) at over 20%. (The example given was GM, which had five years of ROE at 15% but was not profitable.) Wesley R. Gray and Tobias E. Carlisle (2013) Quantitative Value: A Practitioner's Guide to Automating Intelligent Investment and Eliminating Behavioral Errors confirm that Warren Buffett uses ROE but say that both can be used to determine if it’s a Buffett type stock and they will pick up a slightly different group.
Hagstrom is a professional investor but his book just sets out basic principles based on Buffett's letters to shareholders and the investors that influenced his thinking. He admits that Buffets long-term investment return has fallen over time and claims that the army of Buffett style investors created from his books has reduced the potential of using this technique. However, Buffett style investors such as Britain’s Terry Smith and Spain’s Francisco García Paramés have maintained very high rates of return to the present day with international portfolios.
Terry Smith (2020) Investing for Growth: How to make money by only buying the best companies in the world - An anthology of investment writing, 2010-20, sums up the process as investing in “businesses which can somewhat predictably produce a high return on capital employed, in cash, and can invest at least part of that cash back into the business to fund their growth and so compound in value.” (The book is another collection of letters to shareholders and not a how to guide from a notable British proponent of this investing method.)
Wesley R. Gray and Tobias E. Carlisle (2013) Quantitative Value: A Practitioner's Guide to Automating Intelligent Investment and Eliminating Behavioral Errors include an academic proof of how to determine if a company has a Buffett style moat around it or a Durable Competitive Advantage in Buffettology terminology or what they describe as a Franchise, which is a term Buffett used in a 1991 shareholder letter.
The idea behind this investment style is that the retained earnings of the business will over time increase the underlying value of the business if they are properly allocated. The stock market will eventually recognize this increase in value. It is a combination of quality and long-term growth.#'

Market capitalization > 50,000,000
This condition rules out relatively small companies that are unlikely to have the track record to be Buffett style companies.
Net Income(A) / Total Stockholder Equity (A) > 0.15
This line is created in the Create Free Form Condition box and is Return on Equity for the most recent year. Buffett and Clark say that the main criteria that Warren Buffett looks for is a ROE of greater than 15% over a long period of time.
Net Income(A-1) / Total Stockholder Equity(A-1) > 0.15
Net Income(A-2) / Total Stockholder Equity(A-2) > 0.15
Net Income(A-3) / Total Stockholder Equity(A-3) > 0.15
Net Income(A-4) / Total Stockholder Equity(A-4) > 0.15
This condition is repeated for the previous five years. The (A) refers to the most recent annual period and (I) refers to the most recent interim (usually quarterly) period. (A-1) means the one year ago full-year period and (I-1) means the one quarter ago interim.
EBIT(I) > 0
This condition checks that the company is in profit for the most recent quarter and when done for five full years ensures a level of quality.
EBIT(A-1) > 0
This condition checks that Ebit is greater than 0 for the previous year.
EBIT(A-2) > 0
EBIT(A-3) > 0
EBIT(A-4) > 0
Five years of positive EBIT is a quality profitability check that removes a few companies that are too weak to be considered a Buffett style long-term growth and quality candidate.
Gray and Carlisle required an eight-year period for an academic proof that a company is a franchise. I have reduced the time period down to 5 years from 8 years, as we are trying to predict which companies will still have a moat in the future and not prove which companies did in the past.
Long-term free cash flow on assets CFOA = Sum(Eights years Free Cash flow) / Total Assets
( Total Operating Cash Flow(A) + Total Operating Cash Flow(A-1) + Total Operating Cash Flow(A-2) + Total Operating Cash Flow(A-3) + Total Operating Cash Flow(A-4) ) / Total Assets(A) > 0
This criteria uses the Create Free Form Condition box. It is based upon an equation in Gray and Carlisle (2013) that says that for a company to have a Warren Buffett style moat or franchise it needs to create a large amount of total operating cash flow over a long period of time.
0.1 > ( ( Diluted Shares Outstanding(A) - Diluted Shares Outstanding(A-5) ) / Diluted Shares Outstanding(A-5) )
This criteria is made inside the Create Free Form Condition box. This limits the amount of new shares issued over the five-year period to an average of 10% per year.
You could decrease the allowed percentage amount, if you require this criteria to be more rigorous.
The 10% level, again removes only the few very worst offenders. However, some of these companies may have had good reason to issue more shares. So more research is required into what is going on exactly with this dilution.
Warren Buffett likes share buy backs as the reduction in the number of shares outstanding increases the compounding affect and is more tax efficient then dividend payouts. British proponents of this type of investing are not so sure and think that if the company can usefully put the money to work, as has happened at Berkshire Hathaway, they should do so and prefer to see dividends. What is clear is that a company that each year issues its directors a large number of shares will cause investors to have their return diluted. For the company share price to rise when share dilution is occurring, is like a fish trying to swim upstream against a fast current .
LT debt/assets-most recent fiscal year < 0.5
This line rules out a company with very excessive debt. In Buffettology (1999), companies with a durable competitive advantage were described as economic powerhouses that could issues bonds in almost the same manner as an actual country. In The New Buffettology (2012), debt is now much more of a concern. (Warren Buffett invested in the British company Tesco which was paying for its large dividend through debt. He did not notice until everybody else had.)
This screen shows you what companies are likely to be Buffett style franchises in the future and not which ones are the best to buy.
I suggest that you “use fields and criteria as columns” and add P/E excluding extraordinary items and Price to Book most recent quarter as columns and also Earnings Before interest, taxes, Depreciation + Amortization – 5 year CAGR.
You can sort on the total operating cash flow equation and you will find that Warren Buffet’s current favorite company, Apple is present and high up the list. These companies do not necessarily have the highest ROE or even positive growth over the five years, which is the least important criteria. Those with very low P/Es or book values could be bargains but are high risk.
It these companies do indeed have a Buffett style moat it is hard to believe that they will maintain these lowly valuations. However, there is no rush from the likes of Warren Buffett to buy them. It may be a case of “Beware of geeks bearing formulas.” You should consider carefully before buying them, as this screen has no track record.
Exporting screened data to Excel and ranking – The Magic Formula
We are now going to use Screener.co to calculate the Magic Formula, which is a ranking screen that requires data to be exported to Excel to do a ranking function, which Screener.co cannot do internally.
Joel Greenblatt (2006) The Little Book That Beats the Market in 2006 (It was revised in 2010 and is now The Little Book That Still Beats the Market) devised a simple quantitative system he called the Magic Formula. Independent studies have shown that over the long term it has trounced the return from buying a simple market following ETF. This uses two ratio equations that consider earnings, interest, equity price, debt, depreciation of assets, current assets, and current liabilities. Tobias E. Carlisle and Wesley Gray (2013) in their book Quantitative Value: A Practitioner's Guide to Automating Intelligent Investment and Eliminating Behavioral Errors say that Greenblatt was trying to capture Buffett’s investment methodology.

The screen is:
Exchange Country = “USA”
Exchange Traded on != “Over the Counter”
Country Located in = “United States”
The system does not work for companies which are ADRs but does include foreign companies with a main listing on a US exchange. By insisting that the company is located in the USA, we rule out all of these companies. For a closer match to the official website results you should not have this line and must instead look through the results and delete any ADRs. (Thomson Reuters normally puts ‘ADR’ in the company title.) However, this would considerably increase the number of screens that you would have to copy into Excel.
Sector != “Financials”
Sector != “Utilities”
Greenblatt did not think his system worked for Financials and Utilities, so we rule such companies out of the screen.
Market Capitalization >= “50,000,000”
The $50 million market capitalization is the default size on the official Magic formula investing site and allowed a comparison. If you go below this level you will have a lot more screens to copy and transfer.
The Magic Formula gives different answers for different market caps. One source claims the system does not work for companies under $100 million but there is no good reason for this. Indeed the Magic Formula website will work it out for companies that are only $50 million. The only problem for screener.co for the full universe of US companies would mean exporting over 50,000 companies. Due to licensing restrictions on exporting the data, it will only export 50 companies at a time. This would require pasting the data into an Excel sheet some 1000 times. I think that if you were determined you could rank every company in the USA but it would take a considerable amount of time.
The first ratio used in the Magic Formula is Earnings Yield.
EBIT/TEV = Earnings Yield
EBIT-trailing 12 month / Current Enterprise Value (EV)-LFI >= -20
This equation is made in the Create Free Form Condition box. Creating a variable is complex and is meant for use with a condition and we are really after column list. It is possible to put the equation in a Free form Column but if we did that we would get a lot of n/a (not available) results. So instead, I have put -20 on the right hand side of the equation to include the negative data items that could possibly occur. Tick ‘Save right hand side as variable’ and make sure not to tick ‘include n/a variables’.
Greenblatt uses earnings before interest and taxes (EBIT) and compares each company’s EBIT to its total enterprise value (TEV). TEV is the cost a purchaser must pay to buy the whole company. It includes all the equity, including the preferred stock; the debt, which the purchaser must service, any minority interests and adjusts for excess cash, which a purchaser of the whole company may access. He calls EBIT/TEV the ‘earnings yield’. By using EBIT/TEV, rather than earnings on market capitalization, which is the P/E ratio, Greenblatt’s formula allows a comparison on a like-for-like basis of stocks with different capital structures.
Current Enterprise Value (LFI) represents Current Market Capitalization minus Cash and Equivalents plus Total Debt, Minority Interest and Preferred Stock for the last fiscal interim. Current Market Capitalization is calculated as Current Total Shares Outstanding multiplied by the Latest Price Close.
This equation is again made in the Create Free Form Condition box. Place a -20 on the right hand side of the equation to include the negative data items that could possibly occur. Again, tick ‘Save right hand side as variable’ and make sure not to tick ‘include n/a variables’.
The second ratio used in the Magic Formula is Return on Capital.
Earnings before Interest and Taxes (EBIT) /Capital = Return on Capital (ROC)
EBIT-trailing 12 month / Plant, Property, and Equipment(A) >= -20
ROC measures how efficiently management has used the capital employed in the business. The measure specifically excludes excess cash and interest-bearing assets from this calculation to focus only on those assets actually. The higher a stock’s ROC, the more money earned per dollar of capital employed in the business.
An alternative equation is given by Carlisle and Gray (2013) in their book Quantitative Value. They do not actually say that it is different from the one in the book but say that for simplicity, Greenblatt defines capital as net property, plant and equipment, plus net working capital (current assets – current liabilities). Carlisle and Gray only give the explanation, that Greenblatt used this version of ROC at his investment company.
EBIT / Net Property, Plant and Equipment + Net Working Capital (Current Assets – Current Liabilities) = Greenblatt ROC
EBIT(I) / ( Plant, Property, and Equipment(I) + Total Current Assets(I) - Total Current Liabilities(I) ) >= -20
Three different variations of each equation using EBIT(A), Ebit(I) and EBIT-trailing 12 month were tested and the equations listed above are the closest match to the results on the official Magic System website. ROC found more companies but Greenblatt ROC was a closer match. Use only one pair with either ROC or Greenblatt ROC.

Export the data to a spreadsheet using the “Download to Excel” control which is above the data and about halfway down the screen. Do not click save but open it and then move to the second page and open this data. Cut and paste it below the data of the first sheet and then close it. Move on to the third page and repeat for each page until all the data is copied into the first sheet. Check that the number of companies in the spreadsheet matches the number in the Screen. If not, you have made a mistake. If you find duplicates, you have downloaded the same screen more than once.
In Excel insert four columns in between the two main data columns and then copy the name and epic code so both the data columns that are to be ranked have this information next to them. The column in between will be used to rank the selected companies by highest earnings yields and highest return on capital.
Sort each data column to be ranked separately from highest to lowest. To create a ranking column type down a sequence 1, 2, 3, 4 from the top of the sheet. On the number ‘4’ cell press the control button (Ctrl) and then with the mouse grab the square on the bottom right hand side of the column and drag it to the bottom of the data. We have used the Excel ‘Fill’ command to continue this number sequence. Next, sort each column with the company's symbol into Alphabetical order. The company names will now match in both sets of data. Create a formula that adds the two columns together. Then sort all the data on this from lowest to highest. (This is opposite to what you did before.) You could create another ranking column next to this as before with the best company ranked 1.
Greenblatt said that you should buy the top 30 or 50 and hold them for a year and then repeat the ranking process. Calculating the rankings gives a number of advantages. You are not limited to the USA but can calculate the Magic Formula rank for any exchange, country, or region. The ranks are likely to be more up to date and you will know the exact ranking order. If you ranked every share in the US, you could then give every share in your portfolio a Magic Formula rank combined with other information such as 50d moving average could prove to be an interesting exercise to if you should keep or sell them. The British investment writer Richard Beddard has combined the Magic Formula Rank and Piotroski F-score in what he calls his Nifty Thrifty screen. His blog is at http://blog.iii.co.uk.
Tobias E. Carlisle and Wesley Gray in their book Quantitative Value changed the Magic Formula to make even more effective equations with their Quality and Price and Magic Quality screens. You can use these equations in Screener.co. The only problem is that without a ranking function it will take a lot of time to do it for a big universe of companies. Their final Quantitative Value screen was a points based ranking system and used a lot of complex tests for which even professional screening services would have difficulty finding any data to create them. Their own online Quantitative Value screen to support the book, missed these tests out and has now disappeared. A few screening services now offer a simplified Quantitative Value screen.
Writing Screens for Countries with Different Reporting Periods
Some countries have a Quarterly reporting period in which the company gives a financial statement four times a year. Others have a Semi-Annual reporting period in which the companies issue their financial statement just twice a year. The USA, Canada have Quarterly reporting periods but the UK and Australia have a Semi-Annual reporting period. However, it is possible for companies that are in the US to have a semi-annual system and in the UK to have a quarterly reporting period. If you use Screen lines that have period data items in them then it is important to set the Period Type which will be Quarterly or Semi-Annual for your screen.
If we used annual figures then they could be almost a year out of date so it is better to use a look back period of a year from the company’s last report. This is described as Trailing 12 Months (TTM), which uses the last past 12 consecutive months used for reporting financial figures and allows for a like for like comparison between companies and can be used to create financial ratios. Some ratios use the term Last Twelve Months (LTM) rather than TTM but are exactly the same.
TTM Revenue describes the revenue that a company earns over the trailing 12 months (TTM) of business so for a four reporting period year then
TTM Revenue = current Q earnings + Q-1 earnings + Q-2 earnings + Q-3 earnings.
For a two period reporting year
TTM Revenue = current Q earnings + Q-1 earnings
So we need to set the reporting period so that the calculations are correct for every company and we may need to use two almost identical screens but with different reporting periods and equations to fully screen a country or for use in different countries that have different reporting periods.
The following screen is to demonstrate how to create and use TTM and LTM ratios and should not be considered a useable screen. It will find profitable companies that have positive cash flows and are growing at the very least a high rate.
The first screen is for companies that report on a Quarterly basis. This is used by the USA, Canada and the EU countries such as Germany, France, and Italy. The Period Type(I) data item is found in the Financial Statements list.

Period Type(I) = “Quarterly”
This is the stock P/E TTM figure. Without extraordinary items gives it a better comparison across companies. It will find companies with a P/E less than 30, which are considered normally priced rather than expensive
P/E excluding extraordinary items-TTM < 30
This is an EBITDA Margin TTM calculation and means that all the companies are profitable.
( ( EBITDA(I) + EBITDA(I-1) + EBITDA(I-2) + EBITDA(I-3) ) ) / ( ( Total Revenue(I) + Total Revenue(I-1) + Total Revenue(I-2) + Total Revenue(I-3) ) ) > 0.05
This is the stock EPS TTM growth data item and it has been set so that all the companies are growing faster than 15%.
EPS Change-TTM over TTM > 0.15
This is the Enterprise Value-to-Revenue Multiple ratio in LTM terms and is a valuation metric and at more than or equal1 and less than or eual to 3, it suggests the company is fairly priced.
Current EV/Revenue-LTM >= 1
Current EV/Revenue-LTM <= 3
This defines Free Cash Flow Change from the same Reporting Period, a year ago, and sets it to be greater than 0 which means the company's free cash flow has increased from the same period, last year.
( Total Operating Cash Flow(I) + Capital Expenditures(I) - ( Total Operating Cash Flow(I-4) + Capital Expenditures(I-4) ) ) / ( Total Operating Cash Flow(I-4) + Capital Expenditures(I-4) ) > 0
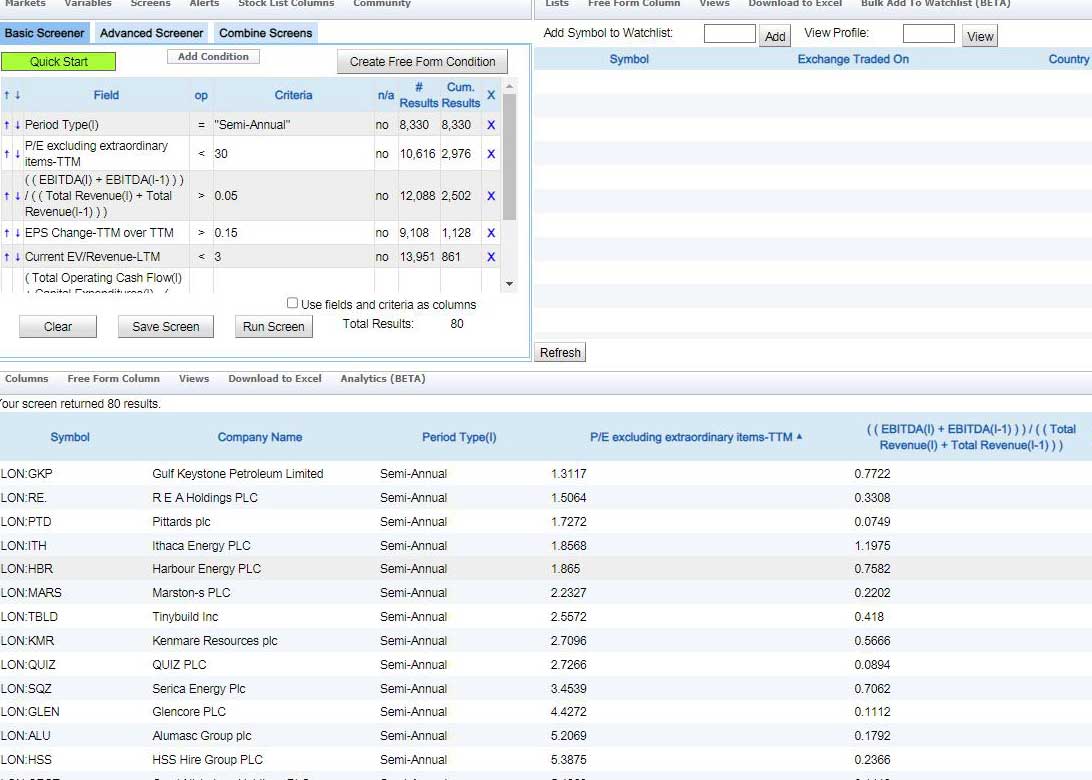
This is the same screen for Semi-Annual or two period reporting years. It is used by the UK, Australia, Hong Kong and Singapore.
Period Type(I) = “Semi-Annual”
P/E excluding extraordinary items-TTM < 30
( ( EBITDA(I) + EBITDA(I-1) ) ) / ( ( Total Revenue(I) + Total Revenue(I-1) ) ) > 0.05
EPS Change-TTM over TTM > 0.15
EV/Revenue – LTM >= 1
EV/Revenue – LTM <= 3
( Total Operating Cash Flow(I) + Capital Expenditures(I) - ( Total Operating Cash Flow(I-2) + Capital Expenditures(I-2) ) ) / ( Total Operating Cash Flow(I-2) + Capital Expenditures(I-2) ) > 0
Improving Screens
Tobias E. Carlisle and Wesley Gray in their book Quantitative Value: A Practitioner's Guide to Automating Intelligent Investment and Eliminating Behavioral Errors (2013) used a number of tests that ruled out the corporate liars and weak companies which they said reduced risk and improved return.
One of the big points of using Screener.co against a service that has readymade screens is that you add such screening lines and reduce risk and increase return or at least save yourself later work in narrowing the field down.
Do not tick the box to rule out companies that are missing the data in the following tests, as we are only interested in ruling out definite offenders.
Moving Averages
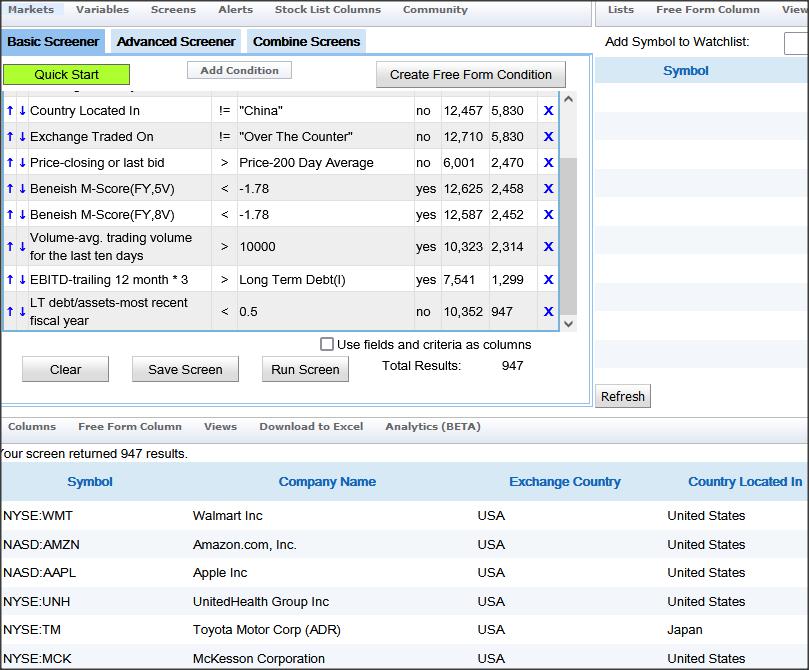
Price-closing or last bid > Price-200 Day Average
We used this line in the Martin Zweig screen and it will cut out shares below their 200-day moving average, which are performing badly from a technical point of view. This will improve the performance of almost any fundamental screen. You can do this for the 150 and 50 Day Moving Averages.
Beneish M-Score
Beneish M-Score (FY,5V) < -1.78
Beneish M-Score (FY,8V) < -1.78
The Beneish M-score uses eight financial ratios weighted by coefficients to identify whether a company has manipulated its profit. It has various levels of the chance a company could be a manipulator. You can use less than -2.22 where there is a strong likelihood of a firm being a manipulator or less than -1.78, which is even stricter.
Using each form of the Beneish M-score will normally remove around 50 companies from the total database that may well be manipulators.
Liquidity
Volume-avg. trading volume for the last ten day > 10,000
This test will remove very illiquid shares from the screen that will have wide spreads and the price will be affected by large buys or sells. It is most useful for microcaps.
Debt
LT debt/assets-most recent fiscal year < 0.5
Or
EBITD-trailing 12 month * 3 > Long Term Debt(I)
Companies with debt are at risk of going bankrupt and there are many tests for this. This line rules out companies that have Long term Total Debt greater than three times their EBITDA and although it will not guarantee that a company cannot go bankrupt will remove excessively risky companies. You are choosing companies that would take up to three years for them pay off their long-term debt with their total earnings.
Advanced Features
The advanced screener supports a subset of MySQL structured query language, which includes logarithms and power calculations. This advanced screen could then be merged with a standard screen. Unfortunately, the current SQL version does not support ranking. Screener.co includes an alert service and screens to set off an alert are created in the Stock List Columns using the standard data item list.
Conclusion
Screener.co is a screener construction kit and is one of the most sophisticated do-it-yourself screening service available for individual investors currently available. Screener.co’s main killer feature is its flexible custom screening formula condition construction. This allows you to create and use financial ratios not provided by the large stock library provide by Refinitiv (Thomson Reuters). This allows the user to create custom screens that would not be possible in other screener services. Screens when run, are created reliably and instantaneously. Screener.co market straddles the area between being a semi-professional and professional investment tool. Screener.co has many positive attributes. It covers all the world's exchanges for a reasonable price. Screener.co's data is updated daily by Refinitiv (Thomson Reuters), one of the world's leading institutional sources of data. It is a powerful do-it-yourself fundamental screening service and you are not paying for stock tips or other frills.
Most other screeners come with several ready-made screens based on books from famous investors of the past. Some of these will allow you to change these screens or create your own. Although this library has a large number of TTM or LTM ratios of the popular ratios, sometimes they are missing and Screener.co allows you to build them. Most other screening services have a wide array of ratios but you may have come across an unusual ratio on Investopedia that are missing from the other screeners. Screener.co will allow you to build this ratio and in general, most financial ratios use relatively simple mathematics. There are several ways to calculate Return on Invested Capital and Screener.co allows you to calculate and use the most accurate one or the one that has the most company returns. Therefore, you do not have to use just the ROIC function given to you by other screening services but have a choice to meet your needs. If a new book comes out with a new and novel investing methodology, then it is likely that you will be able to build it in Screener.co.
Screener.co would like to capture a wide non-professional investment market and it claims to have been created for relatively novice investors. Most free and beginner screener tools allow you to pick a data item such as the P/E and then gave you a choice of the percent to rule in or out the most expensive or cheapest shares. If you also do this for some other data items as well such as debt and free cash flow then you can very conveniently and rapidly create a very decent stock screen in a quantifiable way without having to know when a P/E ratio means that a share is cheap or expensive. (Exactly what a ratio means is often very arguable.) Screener.co does not have the tools to create such screens. You can, however, create a similar screen with all these data items and set them to be above or below an actual P/E or other ratio amount.
Some ratios are only meant to be used to compare companies in the same industry and some stock screeners allow you to pick companies that are above the ratio average for the industry that they are in. You instantly rule out all below-average companies measured by this ratio and this is done dynamically, so if in future the average is higher or lower, it will still work. You cannot do this in Screener.co but you can set the screen to look at a certain industry then choose ratios that are used to analyse companies in this industry and set them to be above or below an appropriate amount.
Not having an internal data ranking function and Excel exports limited to just 50 companies per page makes creating ranked screens such as the Magic Formula much more of a labor-intensive activity. This also prevents the creation of what is probably the current pinnacle of complexity for individual investor screening which is creating James O’Shaughnessy’s composite value ranks. Only a very few services that offer ready-created screens offer such a screen. As a fundamental Screening service, it has limited technical tools. If Screener.co had all these features it would of course cost a lot more.
Director deals and institutional ownership information are blocked by Thomson Reuters for use by individual investors. This is strange as many web sites give free information about director deals based on SEC records. Problems with setting the exchange are largely down to Thomson Reuters and ways to nullify this problem can be found with some thought. These problems are common across most screener services together with the data view limited to 50 companies, especially if the data is provided by Thomson Reuters.
Novice users will find using Screener.co hard going unless they have considerable experience of stock screening and have a good idea of what screens they want to create. They will need to combine this with knowledge of the financial statement and how investment ratios can be calculated from them. Worse, if they use the wrong screening data item this could lead to an expensive investing mistake. Screener.co is not always as user-friendly as it could be and could make it clear what the format of certain data items is in and give more detailed information on data items than the Thomson-Reuters definition.
Hopefully, these example screens and tips will have given you an insight into what Screener.co is capable of doing, has served as a good starting point for your journey into using Screener.co effectively, and begin building a library of screens to use.
Mark Gallear September, 2021 revised 2023.