
Review of Free Stock Screeners using Zweig’s Stock Picking Methodology
Part 3
The CNBC Stock Screener
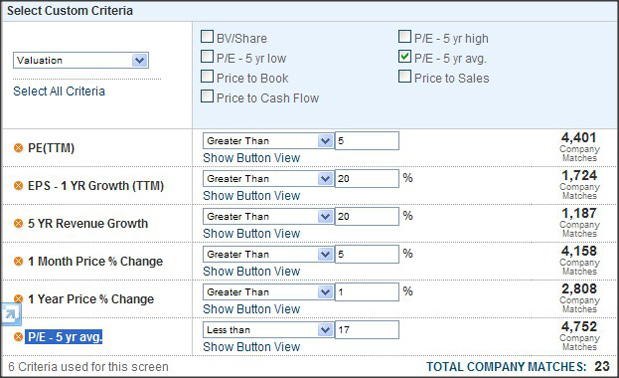
The CNBC Stock Screener does not allow a range for a factor. The P/E -5 year average and the P/E trailing twelve months factors were used to set a range and get around this problem. You can save a screen for future use. I found that not all the listed stock tickers were the full version which caused some confusion.
To simulate a Zweig Screen:
5 YR Revenue Growth greater than or equal to 20%
EPS - 1 YR Growth (Trailing Twelve Months) greater than or equal to 20%
1 Year Price % Change greater than or equal to 1%
1 Month Price % Change greater than or equal to 5%
P/E (Trailing Twelve Months) greater than or equal to 5
P/E - 5 Year Average less than or equal to 17
 |
 |
 |
| The CNBC Stock Screener Matches | Feb-21-12 | Aug-20-12 | % change | Feb-20-13 | % change | |
|---|---|---|---|---|---|---|
| Notes | Companies that appear in more than one screen have a red font | |||||
| Companies that were acquired in the time period have a blue font | ||||||
| EasyLink Services International Corp. (ESIC) was taken over on Jul, 2 2012 by OpenText Corporation | ||||||
| Apple Inc. (AAPL) | 1 sell of US$5 million | 514.85 | 665.15 | 29.2% | 448.85 | -12.8% |
| Chembio Diagnosti (CEMI) | 4 purchases of US$64,000 and 2 sales of US$52,000 | 4.9 | 4.76 | -2.9% | 5.62 | 14.7% |
| Cnooc Limited (CEO) | 221.85 | 201.02 | -9.4% | 198.64 | -10.5% | |
| Companhia Brasile (CBD) | 48.04 | 42.02 | -12.5% | 50.41 | 4.9% | |
| Contango Oil & Ga (MCF) | 4 sales totalling US$5.2 million and 1 purchase of US$13,000 | 64.38 | 56.82 | -11.7% | 42.03 | -34.7% |
| Destiny Media Tec (DSNY) | 4 purchases of US$194,000 | 0.58 | 0.75 | 29.3% | 0.75 | 29.3% |
| Easylink Services (ESIC) | 9 sales of US$158,800 | 4.69 | 7.25 | 54.6% | 7.25 | 54.6% |
| Elong, Incorporat (LONG) | 17.37 | 14.31 | -17.6% | 15.71 | -9.6% | |
| Equity Financial (EQI) | No information available | |||||
| Ezcorp Incorporat (EZPW) | 30.94 | 22.92 | -25.9% | 21.86 | -29.3% | |
| Glentel Inc. (GLNIF) | 22.35 | 18.76 | -16.1% | 16.88 | -24.5% | |
| Gulfport Energy C (GPOR) | 12 sales of US$3.8milion | 37.36 | 25.38 | -32.1% | 37.69 | 0.9% |
| Hollyfrontier Cor (HFC) | 2 sales of US$7.5 million and 4 purchases of US$374,000 | 34.38 | 40.07 | 16.6% | 53.72 | 56.3% |
| Imperial Metals Corp (IPMLF) | 16.5 | 8.99 | -45.5% | 13.6 | -17.6% | |
| Kodiak Oil & Gas (KOG) | 2 sales of US$861,000 | 10.17 | 9.05 | -11.0% | 9 | -11.5% |
| Martinrea Interna (MRETF) | 7.45 | 7.9 | 6.0% | 9.09 | 22.0% | |
| Mesa Laboratories (MLAB) | 3 purchases of US$56,000 | 50.88 | 47.56 | -6.5% | 52.8 | 3.8% |
| New Gold Incorpor ( NGD) | 11.74 | 10.64 | -9.4% | 8.78 | -25.2% | |
| Oneok Partners (OKS) | 60.9 | 56.87 | -6.6% | 60.59 | -0.5% | |
| Parkland Fuel Cor (PKIUF) | 14.9 | 13.83 | -7.2% | 19.24 | 29.1% | |
| Triumph Group (TGI) | 4 sells of US$15 million in total | 64.91 | 63.22 | -2.6% | 73.8 | 13.7% |
| Viropharma Incorp (VPHM) | 3 purchases of US9.4 million and 5 sales of US$5 million | 31.47 | 29.39 | -6.6% | 25.32 | -19.5% |
| -4.2% | 1.6% | |||||
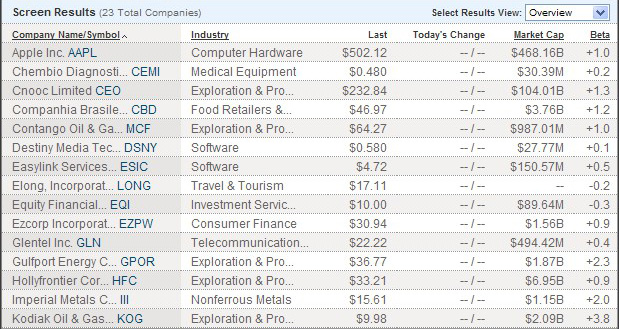
The CNBC stock screener produced 22 results (although it claimed 23) and four of these were shared with at least another screener. One result - Equity Financial (EQI) could no longer be traded which suggests that the database is not as up-to-date as it could be. The CNBC screener produced a -4.2% fall over six months and a 1.6% gain over a year. This was the worse result of all the stock screeners over six months and although it just managed a positive result over a year was far worse than that achieved by the S&P 500.
| The CNBC Stock Screener Matches with only sells removed | Feb-21-12 | Aug-20-12 | % change | Feb-20-13 | % change | |
|---|---|---|---|---|---|---|
| Notes | Companies that appear in more than one screen have a red font | |||||
| Chembio Diagnosti (CEMI) | 4 purchases of US$64,000 and 2 sales of US$52,000 | 4.9 | 4.76 | -2.9% | 5.62 | 14.7% |
| Cnooc Limited (CEO) | 221.85 | 201.02 | -9.4% | 198.64 | -10.5% | |
| Companhia Brasile (CBD) | 48.04 | 42.02 | -12.5% | 50.41 | 4.9% | |
| Contango Oil & Ga (MCF) | 4 sales totalling US$5.2 million and 1 purchase of US$13,000 | 64.38 | 56.82 | -11.7% | 42.03 | -34.7% |
| Destiny Media Tec (DSNY) | 4 purchases of US$194,000 | 0.58 | 0.75 | 29.3% | 0.75 | 29.3% |
| Elong, Incorporat (LONG) | 17.37 | 14.31 | -17.6% | 15.71 | -9.6% | |
| Ezcorp Incorporat (EZPW) | 30.94 | 22.92 | -25.9% | 21.86 | -29.3% | |
| Glentel Inc. (GLNIF) | 22.35 | 18.76 | -16.1% | 16.88 | -24.5% | |
| Hollyfrontier Cor (HFC) | 2 sales of US$7.5 million and 4 purchases of US$374,000 | 34.38 | 40.07 | 16.6% | 53.72 | 56.3% |
| Imperial Metals Corp (IPMLF) | 16.5 | 8.99 | -45.5% | 13.6 | -17.6% | |
| Martinrea Interna (MRETF) | 7.45 | 7.9 | 6.0% | 9.09 | 22.0% | |
| Mesa Laboratories (MLAB) | 3 purchases of US$56,000 | 50.88 | 47.56 | -6.5% | 52.8 | 3.8% |
| New Gold Incorpor ( NGD) | 11.74 | 10.64 | -9.4% | 8.78 | -25.2% | |
| Oneok Partners (OKS) | 60.9 | 56.87 | -6.6% | 60.59 | -0.5% | |
| Parkland Fuel Cor (PKIUF) | 14.9 | 13.83 | -7.2% | 19.24 | 29.1% | |
| Viropharma Incorp (VPHM) | 3 puchases of US9.4 million and 5 sales of US$5 million | 31.47 | 29.39 | -6.6% | 25.32 | -19.5% |
| -7.9% | -0.7% | |||||
| The CNBC Stock Screener Matches with sells over $5 million removed | Feb-21-12 | Aug-20-12 | % change | Feb-20-13 | % change | |
|---|---|---|---|---|---|---|
| Notes | Companies that appear in more than one screen have a red font | |||||
| Companies that were acquired in the time period have a blue font | ||||||
| EasyLink Services International Corp. (ESIC) was taken over on Jul, 2 2012 by OpenText Corporation | ||||||
| Chembio Diagnosti (CEMI) | 4 purchases of US$64,000 and 2 sales of US$52,000 | 4.9 | 4.76 | -2.9% | 5.62 | 14.7% |
| Cnooc Limited (CEO) | 221.85 | 201.02 | -9.4% | 198.64 | -10.5% | |
| Companhia Brasile (CBD) | 48.04 | 42.02 | -12.5% | 50.41 | 4.9% | |
| Destiny Media Tec (DSNY) | 4 purchases of US$194,000 | 0.58 | 0.75 | 29.3% | 0.75 | 29.3% |
| Easylink Services (ESIC) | 9 sales of US$158,800 | 4.69 | 7.25 | 54.6% | 7.25 | 54.6% |
| Elong, Incorporat (LONG) | 17.37 | 14.31 | -17.6% | 15.71 | -9.6% | |
| Ezcorp Incorporat (EZPW) | 30.94 | 22.92 | -25.9% | 21.86 | -29.3% | |
| Glentel Inc. (GLNIF) | 22.35 | 18.76 | -16.1% | 16.88 | -24.5% | |
| Gulfport Energy C (GPOR) | 12 sales of US$3.8milion | 37.36 | 25.38 | -32.1% | 37.69 | 0.9% |
| Imperial Metals Corp (IPMLF) | 16.5 | 8.99 | -45.5% | 13.6 | -17.6% | |
| Kodiak Oil & Gas (KOG) | 2 sales of US$861,000 | 10.17 | 9.05 | -11.0% | 9 | -11.5% |
| Martinrea Interna (MRETF) | 7.45 | 7.9 | 6.0% | 9.09 | 22.0% | |
| Mesa Laboratories (MLAB) | 3 purchases of US$56,000 | 50.88 | 47.56 | -6.5% | 52.8 | 3.8% |
| New Gold Incorpor ( NGD) | 11.74 | 10.64 | -9.4% | 8.78 | -25.2% | |
| Oneok Partners (OKS) | 60.9 | 56.87 | -6.6% | 60.59 | -0.5% | |
| Parkland Fuel Cor (PKIUF) | 14.9 | 13.83 | -7.2% | 19.24 | 29.1% | |
| -7.0% | 1.9% | |||||
If we remove companies that had insider transaction sells but not buys and sells then the remaining 16 companies had a loss of -7.9% over six months and a loss of -0.7% over a year. This is again worse than if they were left in. If only insider transaction sells of at least $5 million are removed then for the 16 remaining companies after six months they declined -7.1% and after a year they increased 1.9%. This is a worse result over six months but slightly better over a year than if all the insider sell transactions had been included in the portfolio.
The Zacks Custom Screener
The Zacks Custom Screener allows you to enter a factor then set a criteria but not a range by the side of it. The screen is saved as long as the cookie remains on your computer. It has a large number of detailed factors to use and the helpful ? symbol will give you an actual explanation of what the stock screen factor actually does. Clicking on the ticker will give a pop-up page with more detailed information and a graph about the company. Some factors concerning Zacks own ranks and recommendations are for premium subscribers only. If you join Zacks premium services you can back test the screen and uniquely it allows statistical analysis of certain factors.
To simulate a Zweig Screen:
% Price Change (12 Weeks) greater than or equal to 5%
% Price Change (Year to Date) greater than or equal to 1%
P/E (Current Fiscal Year Estimate - F1) less than or equal to 15
P/E (F1) greater than or equal to 5
Net Income Growth (The current fiscal year's net income growth estimate divided by last years) greater than or equal to 20
12 Month Net Income Current/Last % greater than or equal to 20%
5 Year Historic EPS Growth greater than or equal to 20
Last Years Growth greater than or equal to 20
5 Year Historical Sales Growth greater than or equal to 20
Sales Growth greater than or equal to 20
 |
 |
 |
 |
| The Zacks Custom Screener Matches | Feb-21-12 | Aug-20-12 | % change | Feb-20-13 | % change | |
|---|---|---|---|---|---|---|
| Notes | Companies that appear in more than one screen have a red font | |||||
| Companies that were acquired in the time period have a blue font | ||||||
| EasyLink Services International Corp. (ESIC) was taken over on Jul, 2 2012 by OpenText Corporation | ||||||
| ASIAINFO LINKAGE Inc (ASIA) | 12.95 | 11.97 | -7.6% | 10.97 | -15.3% | |
| GRAN TIERRA EGY (GTE) | 4 sells of US$4 million and 1 purchases of US$48,000 | 6 | 4.74 | -21.0% | 5.48 | -8.7% |
| AGRIUM INC (AGU) | 85.07 | 101.16 | 18.9% | 108.86 | 28.0% | |
| ECOPETROLADR (EC) | 55.35 | 59.43 | 7.4% | 53.71 | -3.0% | |
| NETEASE.COMADR (NTES) | 48.26 | 48.84 | 1.2% | 52.91 | 9.6% | |
| BRF-BRASIL FOOD (BRFS) | 20.85 | 15.35 | -26.4% | 21.38 | 2.5% | |
| APPLE INC (AAPL) | 1 sell of US$5 million | 514.85 | 665.15 | 29.2% | 448.85 | -12.8% |
| BIO REFERNC (BRLI) | 3 purchases of US$244,00 | 20.16 | 29.71 | 47.4% | 26.26 | 30.3% |
| Express Scripts Inc (ESRX) | 52.31 | 60.17 | 15.0% | 57.29 | 9.5% | |
| COINSTAR INC (CSTR) | 8 sells of US$3.4 million | 58.22 | 51.83 | -11.0% | 53.75 | -7.7% |
| China Automotive Systems Inc (CAAS) | 6 purchases of US$207,000 | 5.08 | 3.78 | -25.6% | 5.02 | -1.2% |
| Ballantyne Strong Inc (BTN) | 5.08 | 4 | -21.3% | 3.61 | -28.9% | |
| CLIFFS NATURAL Resources INC (CLF) | 3 sells US$31,000 | 66.27 | 41.64 | -37.2% | 27.29 | -58.8% |
| Titan Machinery Inc (TITN) | 4 sells of US$18,4 million | 27.66 | 26.93 | -2.6% | 29.32 | 6.0% |
| EasyLink Services International Corp (ESIC) | 9 sells of US$159,000 | 4.69 | 7.25 | 54.6% | 7.25 | 54.6% |
| Yamana Gold Inc (AUY) | 17.12 | 15.47 | -9.6% | 14.4 | -15.9% | |
| 0.7% | -0.7% | |||||
The Zacks Custom Screen produced 16 matches of which five appeared in at least one other screener. The matches over six months increased 0.7% and over a year lost -0.7%. If we remove the insider transaction sells but not the mixed purchases and sells then the remaining 11 companies gave a -2% loss over six months and a 0.6% gain over a year. This is worse over six months but slightly better over a year than if they were left in the portfolio.
| The Zacks Custom Screener Matches with only sells removed | Feb-21-12 | Aug-20-12 | % change | Feb-20-13 | % change | |
|---|---|---|---|---|---|---|
| Notes | Companies that appear in more than one screen have a red font | |||||
| ASIAINFO LINKAGE Inc (ASIA) | 12.95 | 11.97 | -7.6% | 10.97 | -15.3% | |
| GRAN TIERRA EGY (GTE) | 4 sells of US$4 million and 1 purchases of US$48,000 | 6 | 4.74 | -21.0% | 5.48 | -8.7% |
| AGRIUM INC (AGU) | 85.07 | 101.16 | 18.9% | 108.86 | 28.0% | |
| ECOPETROLADR (EC) | 55.35 | 59.43 | 7.4% | 53.71 | -3.0% | |
| NETEASE.COMADR (NTES) | 48.26 | 48.84 | 1.2% | 52.91 | 9.6% | |
| BRF-BRASIL FOOD (BRFS) | 20.85 | 15.35 | -26.4% | 21.38 | 2.5% | |
| BIO REFERNC (BRLI) | 3 purchases of US$244,00 | 20.16 | 29.71 | 47.4% | 26.26 | 30.3% |
| Express Scripts Inc (ESRX) | 52.31 | 60.17 | 15.0% | 57.29 | 9.5% | |
| China Automotive Systems Inc (CAAS) | 6 purchases of US$207,000 | 5.08 | 3.78 | -25.6% | 5.02 | -1.2% |
| Ballantyne Strong Inc (BTN) | 5.08 | 4 | -21.3% | 3.61 | -28.9% | |
| Yamana Gold Inc (AUY) | 17.12 | 15.47 | -9.6% | 14.4 | -15.9% | |
| -2.0% | 0.6% | |||||
| The Zacks Custom Screener with sells over $5 million removed | Feb-21-12 | Aug-20-12 | % change | Feb-20-13 | % change | |
|---|---|---|---|---|---|---|
| Notes | Companies that appear in more than one screen have a red font | |||||
| Companies that were acquired in the time period have a blue font | ||||||
| ASIAINFO LINKAGE Inc (ASIA) | 12.95 | 11.97 | -7.6% | 10.97 | -15.3% | |
| GRAN TIERRA EGY (GTE) | 4 sells of US$4 million and 1 purchases of US$48,000 | 6 | 4.74 | -21.0% | 5.48 | -8.7% |
| AGRIUM INC (AGU) | 85.07 | 101.16 | 18.9% | 108.86 | 28.0% | |
| ECOPETROLADR (EC) | 55.35 | 59.43 | 7.4% | 53.71 | -3.0% | |
| NETEASE.COMADR (NTES) | 48.26 | 48.84 | 1.2% | 52.91 | 9.6% | |
| BRF-BRASIL FOOD (BRFS) | 20.85 | 15.35 | -26.4% | 21.38 | 2.5% | |
| APPLE INC (AAPL) | 1 sell of US$5 million | 514.85 | 665.15 | 29.2% | 448.85 | -12.8% |
| BIO REFERNC (BRLI) | 3 purchases of US$244,00 | 20.16 | 29.71 | 47.4% | 26.26 | 30.3% |
| Express Scripts Inc (ESRX) | 52.31 | 60.17 | 15.0% | 57.29 | 9.5% | |
| COINSTAR INC (CSTR) | 8 sells of US$3.4 million | 58.22 | 51.83 | -11.0% | 53.75 | -7.7% |
| China Automotive Systems Inc (CAAS) | 6 purchases of US$207,000 | 5.08 | 3.78 | -25.6% | 5.02 | -1.2% |
| Ballantyne Strong Inc (BTN) | 5.08 | 4 | -21.3% | 3.61 | -28.9% | |
| CLIFFS NATURAL Resources INC (CLF) | 3 sells US$31,000 | 66.27 | 41.64 | -37.2% | 27.29 | -58.8% |
| EasyLink Services International Corp (ESIC) | 9 sells of US$159,000 | 4.69 | 7.25 | 54.6% | 7.25 | 54.6% |
| Yamana Gold Inc (AUY) | 17.12 | 15.47 | -9.6% | 14.4 | -15.9% | |
| 0.9% | -1.2% | |||||
If only insider transaction sells of at least $5 million are removed then for the 16 remaining companies there was a 0.9% increase after six months but a -1.2% decline after a year. This is slightly better after six months but slightly worse after a year than if all the insider transaction sells had been bought.
Nasdaq Guru Stock Screener
The Nasdaq Guru Stock Screener has the characteristics of the stock screen hidden but will give you a list of shares that are in keeping with the strategy of a stock market guru such as Zweig. Many of the choices it gives have P/E ratios that would make these stocks far too expensive for Zweig’s stock picking criteria. However, two of the choices were in at least another screener. One match was no longer being traded on the day the screen was run which suggests that these picks were already out of date.
 |
 |
| Nasdaq Guru Stock Screener Matches | Feb-21-12 | Aug-20-12 | % change | Feb-20-13 | % change | |
|---|---|---|---|---|---|---|
| Notes | Companies that appear in more than one screen have a red font | |||||
| ALTISOURCE PORTFOLIO SOLUTIONS S.A. (ASPS) | 1 purchases of US$80,00 and 2 sells of US$687,000 | 60.16 | 90.05 | 49.7% | 85 | 41.3% |
| AMERICAN PUBLIC EDUCATION, INC (APEI) | 1 purchases of US$12.6 million and 11 sells of US$1.5 million | 42.12 | 34.01 | -19.3% | 41.33 | -1.9% |
| APPLE INC. (AAPL) | 1 sell of US$5 million | 514.85 | 665.15 | 29.2% | 448.85 | -12.8% |
| BUFFALO WILD WINGS (BWLD) | 11 sells of US$1.8 million | 86.38 | 74.65 | -13.6% | 75.45 | -12.7% |
| CACI INTERNATIONAL INC (CACI) | 1 sell of US$55,000 | 59.46 | 52.7 | -11.4% | 52.9 | -11.0% |
| COINSTAR, INC. (CSTR) | 8 sells of US$2.5 million | 58.22 | 51.83 | -11.0% | 53.75 | -7.7% |
| DISCOVER FINANCIAL SERVICES (DFS) | 1 sell OF US$1.2 million | 29.69 | 37.17 | 25.2% | 38.93 | 31.1% |
| EXPONENT, INC. EXPO | 13 sells of US$2.7 million | 47.47 | 51.88 | 9.3% | 51.17 | 7.8% |
| GREEN MOUNTAIN COFFEE ROASTERS INC. (GMCR) | 3 purchases of US$3,10 and 3 sells of US$35 million | 69.75 | 24.34 | -65.1% | 45.76 | -34.4% |
| NIC INC. (EGOV) | 2 sells of US$163,000 | 12.77 | 14.33 | 12.2% | 16.95 | 32.7% |
| SYNOVIS LIFE TECHNOLOGIES, INC (SYNO) | No longer traded | |||||
| 0.53% | 3.25% | |||||
The 11 Nasdaq Guru choices increased 0.53% over six months and 3.25% over a year. There were no picks without insider transaction sells in this portfolio but if the three stocks with sells and purchases by insiders are just bought then the loss increases to -11.6% over six months and an increase of 1.7% over a year. If only insider transaction sells of at least $5 million are removed then the remaining portfolio of 8 companies had growth of 5.2% over six months and 10% over a year. This is a much better result than if a full portfolio with all the shares with sell insider transactions had been bought and slightly better than the S&P 500 after six months but slightly worse after a year.
| Nasdaq Guru Stock Screener Matches with only sells removed | Feb-21-12 | Aug-20-12 | % change | Feb-20-13 | % change | |
|---|---|---|---|---|---|---|
| ALTISOURCE PORTFOLIO SOLUTIONS S.A. (ASPS) | 1 purchases of US$80,00 and 2 sells of US$687,000 | 60.16 | 90.05 | 49.68% | 85 | 41.29% |
| AMERICAN PUBLIC EDUCATION, INC (APEI) | 1 purchases of US$12.6 million and 11 sells of US$1.5 million | 42.12 | 34.01 | -19.25% | 41.33 | -1.88% |
| GREEN MOUNTAIN COFFEE ROASTERS INC. (GMCR) | 3 purchases of US$3,10 and 3 sells of US$35 million | 69.75 | 24.34 | -65.10% | 45.76 | -34.39% |
| -11.56% | 1.67% | |||||
| Nasdaq Guru Stock Screener Matches with sells over $5 million removed | Feb-21-12 | Aug-20-12 | % change | Feb-20-13 | % change | |
|---|---|---|---|---|---|---|
| Notes | Companies that appear in more than one screen have a red font | |||||
| ALTISOURCE PORTFOLIO SOLUTIONS S.A. (ASPS) | 1 purchases of US$80,00 and 2 sells of US$687,000 | 60.16 | 90.05 | 49.7% | 85 | 41.3% |
| AMERICAN PUBLIC EDUCATION, INC (APEI) | 1 purchases of US$12.6 million and 11 sells of US$1.5 million | 42.12 | 34.01 | -19.3% | 41.33 | -1.9% |
| BUFFALO WILD WINGS (BWLD) | 11 sells of US$1.8 million | 86.38 | 74.65 | -13.6% | 75.45 | -12.7% |
| CACI INTERNATIONAL INC (CACI) | 1 sell of US$55,000 | 59.46 | 52.7 | -11.4% | 52.9 | -11.0% |
| COINSTAR, INC. (CSTR) | 8 sells of US$2.5 million | 58.22 | 51.83 | -11.0% | 53.75 | -7.7% |
| DISCOVER FINANCIAL SERVICES (DFS) | 1 sell of US$1.2 million | 29.69 | 37.17 | 25.2% | 38.93 | 31.1% |
| EXPONENT, INC. EXPO | 13 sells of US$2.7 million | 47.47 | 51.88 | 9.3% | 51.17 | 7.8% |
| NIC INC. (EGOV) | 2 sells of US$163,000 | 12.77 | 14.33 | 12.2% | 16.95 | 32.7% |
| 5.2% | 10.0% | |||||
Insider Transactions
Ruling out stocks with insider transaction sells did not improve the results of the screeners but actually made them worse. If you rule out only companies with large insider transaction sells of at least $5 million than the result is better than if they were all removed. For the best performing stock screens there is a very marked improvement putting them at the performance level of the best human stock managers over a long period of time but for the others it is more mixed with small or no improvement and sometimes only for the six month or a year time period.
| Insider purchases from all the stock screeners | Feb-21-12 | Aug-20-12 | % change | Feb-20-13 | % change | |
|---|---|---|---|---|---|---|
| Notes | Companies that appear in more than one screen have a red font | |||||
| Companies that were acquired in the time period have a blue font | ||||||
| Sun Healthcare Group Inc (SUNH) was taken over on Dec 3, 2012 by Genesis Healthcare LLC | ||||||
| Transcend Services Inc (TRCR) was taken over on Apr 26, 2012 by Nuance Communications Inc | ||||||
| Sun Healthcare Group Inc (SUNH) | 4 purchases for a total of around US$60,000 | 4.47 | 8.44 | 88.8% | 8.5 | 90.2% |
| Main Street Capital Corp (MAIN) | 7 purchases totalingUS$466,000 | 23.52 | 27.47 | 16.8% | 32.06 | 36.3% |
| Destiny Media Tec (DSNY) | 4 purchases of US$194,000 | 0.58 | 0.75 | 29.3% | 0.75 | 29.3% |
| Mesa Laboratories (MLAB) | 3 purchases of US$56,000 | 50.88 | 47.56 | -6.5% | 52.8 | 3.8% |
| BIO REFERNC (BRLI) | 3 purchases of US$244,00 | 20.16 | 29.71 | 47.4% | 26.26 | 30.3% |
| China Automotive Systems Inc (CAAS) | 6 purchases of US$207,000 | 5.08 | 3.78 | -25.6% | 5.02 | -1.2% |
| 25.3% | 31.5% | |||||
| Mixed Insider sells and purchases from all the stock screeners | Feb-21-12 | Aug-20-12 | % change | Feb-20-13 | % change | |
|---|---|---|---|---|---|---|
| Notes | Companies that were acquired in the time period have a blue font | |||||
| Transcend Services Inc (TRCR) was taken over on Apr 26, 2012 by Nuance Communications Inc | ||||||
| Tower Group Inc (TWGP) | 3 sells of US$330,000 and a purchase of US$20,000 | 23.41 | 18.82 | -19.6% | 19.79 | -15.5% |
| Transcend Services Inc (TRCR) | 1 purchase of US$107,000 and 10 sells of US$1.9 million | 22.38 | 29.57 | 32.1% | 29.57 | 32.1% |
| ALTISOURCE PORTFOLIO SOLUTIONS S.A. (ASPS) | 1 purchases of US$80,00 and 2 sells of US$687,000 | 60.16 | 90.05 | 49.7% | 85 | 41.3% |
| AMERICAN PUBLIC EDUCATION, INC (APEI) | 1 purchases of US$12.6 million and 11 sells of US$1.5 million | 42.12 | 34.01 | -19.3% | 41.33 | -1.9% |
| GREEN MOUNTAIN COFFEE ROASTERS INC. (GMCR) | 3 purchases of US$3,10 and 3 sells of US$35 million | 69.75 | 24.34 | -65.1% | 45.76 | -34.4% |
| -4.4% | 4.3% | |||||
Zweig preferred to invest in companies that had recent insider transaction purchases. If stocks with this characteristic are taken from all the stock screeners then a portfolio of 6 stocks is formed which give a 25% gain over 6 months and 31.5% over a year. One of these companies was taken over during the year and two companies fell over six months but had largely recovered over the year. This is a much better result than the S&P 500 index by a magnitude of three times over a year. There are not enough companies with both buy and sell insider transactions to have a clear view on their trend but they either seem to either drop or rise significantly in value with the worst performing stock having the highest value of insider transaction sells.
The Best Free Stock Screeners - Review Conclusions
The Google and Financial Times Global Equity Screener did much better than the other screeners in this test. They have more features and most importantly are able to set a range to a searchable factor and even have the option of screening for international stocks. Interestingly, they are not a cut down free version of a pay for screener but are a free service provided by major investment news and information providers.
The CNBC was the only screen that used past year figures rather than 5 year average figures and it would have been better to have used P/E (Trailing Twelve Months) less than or equal to 17. The CNBC screener does show the criteria asked for in the results and so you cannot easily rule out by hand any company results with a P/E less than 5. It would be necessary to look up each company and check the trailing P/E on a website such as Yahoo! Finance.
I have retested the CNBC Screener against a pay for screener using the same criteria for a Zweig screen and found that the CNBC Screener found 17 companies (Including some on the Toronto Exchange) but the pay for screener found only 7 and there was not a single match between them. I checked the details of some of these companies and according to the figures on Yahoo! Finance many of these companies did not have the required factors and so I suspect that the CNBC screener database may not be as up to date as it could be.
Just using a Zweig stock screen methodology does not guarantee to give a good performance, as the other stock screeners that were reviewed did not match the S&P 500 over the same period and many gave a negative performance.
The stock screeners with high gains did much better over the first six months than over a twelve month period as they found companies that were taken over in the short term. The S&P 500 did better in the second half of the year. Likewise some of the poorer performing screens recovered in the second half of the year.
Zweig's extra test for insider buys and sells did change the success of his methodology. Discarding matches with insider transaction sells but not buys and sells does not make the results better and strangely makes them worse. Discarding matches that only have large insider transaction sells helped improve the results of the best stock screeners by a noticeable amount, so that their performance was better than the S&P 500 by a wide margin. For the other stock screeners it was a more mixed result but overall was marginally better. However, picking only companies that had insider transaction buys gave a significantly better performance and matched the performance that the very best human stock pickers can achieve over a long period of time. This could be a powerful additional strategy element to improve the performance of a stock screening methodology.
Be warned that the one-off nature and small scope of this test means that the conclusions cannot be statistically proven and are unlikely to be exactly replicated in the future.