
Review of Free Stock Screeners using Zweig’s Stock Picking Methodology
Part 2
Finviz
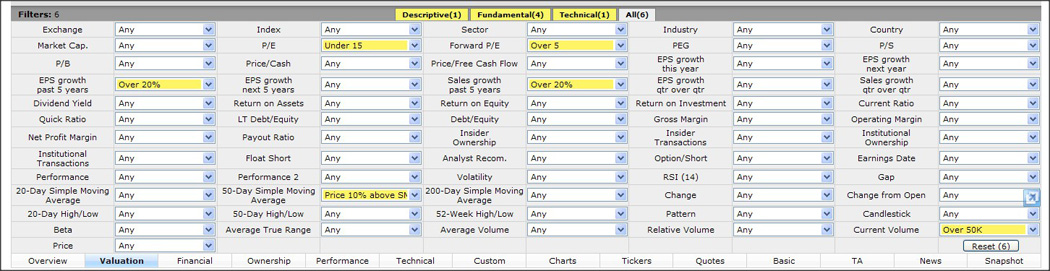
The Finviz Stock Screener covers the US stock exchanges. It has 15 descriptive, 29 fundamental and 17 technical factors that can be used in a screen. It does not allow a screen to be saved and you cannot do a range in a factor. A P/E within a range was created by using the Forward P/E to screen out companies with too low a P/E. It is less flexible than other screeners in that you have less choice in the range you can set a factor. Although the Finviz screener does include important factors such as EPS growth quarter over quarter which are missing from other screeners.
To simulate a Zweig Screen:
EPS Growth over past 5 years greater than 20%
Sales Growth past 5 years greater than 20%
EPS Growth this year greater than 20%
P/E less than 15
Forward P/E greater than 5
Current Volume greater than 50,000
50-Day Simple Moving Average Price - 10% above the 50-Day Simple Moving Average
 |
 |
| Finviz Matches | Feb-21-12 | Aug-20-12 | % change | Feb-20-13 | % change | |
|---|---|---|---|---|---|---|
| Notes | Companies that appear in more than one screen have a red font | |||||
| Companies that were acquired in the time period have a blue font | ||||||
| Sun Healthcare Group Inc (SUNH) was taken over on Dec 3, 2012 by Genesis Healthcare LLC | ||||||
| Apple Inc (AAPL) | 1 sell of US$5 million | 514.85 | 665.15 | 29.2% | 448.85 | -12.8% |
| Agrium Inc. (AGU) | 85.07 | 101.16 | 18.9% | 108.86 | 28.0% | |
| Aixtron ADR (AIXG) | 17.65 | 14.95 | -15.3% | 12.21 | -30.8% | |
| Asiainfo Linkage Inc (ASIA) | 12.95 | 11.97 | -7.6% | 10.97 | -15.3% | |
| AXT Inc (AXTI) | 5.16 | 3.28 | -36.4% | 2.9 | -43.8% | |
| CF Industries Hldg Inc (CF) | 3 sells of around US$19 million in total | 184.3 | 215.58 | 17.0% | 207.07 | 12.4% |
| CNinsure Inc (CISG) | 8.77 | 5.8 | -33.9% | 5.8 | -33.9% | |
| Ezcorp Inc (EZPW) | 31.21 | 22.92 | -26.6% | 21.86 | -30.0% | |
| Guess? Inc (GES) | 34.45 | 32.86 | -4.6% | 28.44 | -17.4% | |
| GT Advanced Technologies Inc (GTAT) | 2 sells of around US$1 million in total | 9.37 | 6.64 | -29.1% | 3.39 | -63.8% |
| Iconix Brand Group Inc (ICON) | 1 Sell of US$4.3 million | 20.93 | 18.56 | -11.3% | 23.68 | 13.1% |
| Medifast Inc (MED) | 1 sell of $US45,000 | 16.87 | 28.52 | 69.1% | 24.36 | 44.4% |
| Rubicon Technology Inc (RBCN) | 12 | 9.16 | -23.7% | 5.77 | -51.9% | |
| Sun Healthcare Group Inc (SUNH) | 4 purchases for a total of around US$60,000 | 4.47 | 8.44 | 88.8% | 8.5 | 90.2% |
| Titan Machinery Inc (TITN) | 2 sells of US$14 million in total | 27.66 | 26.93 | -2.6% | 29.32 | 6.0% |
| Tower Group Inc (TWGP) | 3 sells of US$330,000 and a purchase of US$20,000 | 23.41 | 18.82 | -19.6% | 19.79 | -15.5% |
| 0.8% | -7.6% | |||||
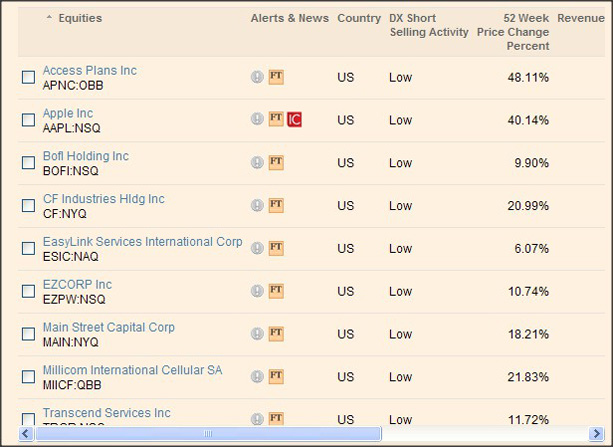
This screen on Finviz produced 16 matches. Five of the stocks were also found by at least one of the other stock screeners. The Finviz matches had the worst results over the time period of a year of all the stock screeners. If you had put an equal amount of money in each share match then after six months you would have had a 0.76% gain and after a year an -7.57% loss. This compares with a 4.1% gain for the S&P 500 index after six months and 11% after a year. Despite this, Finviz did find the best performing stock in all of the stock screeners. This was Sun Healthcare Group Inc (SUNH) which was taken over on December 3, 2012 by Genesis HealthCare LLC. Sun Healthcare on its last reported date on the stock market showed a gain of 90.2%.
| Finviz Matches with only sells removed | Feb-21-12 | Aug-20-12 | % change | Feb-20-13 | % change | |
|---|---|---|---|---|---|---|
| Notes | Companies that appear in more than one screen have a red font | |||||
| Companies that were acquired in the time period have a blue font | ||||||
| Sun Healthcare Group Inc (SUNH) was taken over on Dec 3, 2012 by Genesis Healthcare LLC | ||||||
| Agrium Inc. (AGU) | 85.07 | 101.16 | 18.9% | 108.86 | 28.0% | |
| Aixtron ADR (AIXG) | 17.65 | 14.95 | -15.3% | 12.21 | -30.8% | |
| Asiainfo Linkage Inc (ASIA) | 12.95 | 11.97 | -7.6% | 10.97 | -15.3% | |
| AXT Inc (AXTI) | 5.16 | 3.28 | -36.4% | 2.9 | -43.8% | |
| CNinsure Inc (CISG) | 8.77 | 5.8 | -33.9% | 5.8 | -33.9% | |
| Ezcorp Inc (EZPW) | 31.21 | 22.92 | -26.6% | 21.86 | -30.0% | |
| Guess? Inc (GES) | 34.45 | 32.86 | -4.6% | 28.44 | -17.4% | |
| Rubicon Technology Inc (RBCN) | 12 | 9.16 | -23.7% | 5.77 | -51.9% | |
| Sun Healthcare Group Inc (SUNH) | 4 purchases for a total of around US$60,000 | 4.47 | 8.44 | 88.8% | 8.5 | 90.2% |
| Tower Group Inc (TWGP) | 3 sells of US$330,000 and a purchase of US$20,000 | 23.41 | 18.82 | -19.6% | 19.79 | -15.5% |
| -6.0% | -12.0% | |||||
| Finviz Matches with sells over $5 million removed | Feb-21-12 | Aug-20-12 | % change | Feb-20-13 | % change | |
|---|---|---|---|---|---|---|
| Notes | Companies that appear in more than one screen have a red font | |||||
| Companies that were acquired in the time period have a blue font | ||||||
| Sun Healthcare Group Inc (SUNH) was taken over on Dec 3, 2012 by Genesis Healthcare LLC | ||||||
| Agrium Inc. (AGU) | 85.07 | 101.16 | 18.9% | 108.86 | 28.0% | |
| Aixtron ADR (AIXG) | 17.65 | 14.95 | -15.3% | 12.21 | -30.8% | |
| Asiainfo Linkage Inc (ASIA) | 12.95 | 11.97 | -7.6% | 10.97 | -15.3% | |
| AXT Inc (AXTI) | 5.16 | 3.28 | -36.4% | 2.9 | -43.8% | |
| CNinsure Inc (CISG) | 8.77 | 5.8 | -33.9% | 5.8 | -33.9% | |
| Ezcorp Inc (EZPW) | 31.21 | 22.92 | -26.6% | 21.86 | -30.0% | |
| Guess? Inc (GES) | 34.45 | 32.86 | -4.6% | 28.44 | -17.4% | |
| GT Advanced Technologies Inc (GTAT) | 2 sells of around US$1 million in total | 9.37 | 6.64 | -29.1% | 3.39 | -63.8% |
| Iconix Brand Group Inc (ICON) | 1 sell of US$4.3 million | 20.93 | 18.56 | -11.3% | 23.68 | 13.1% |
| Medifast Inc (MED) | 1 sell of $US45,000 | 16.87 | 28.52 | 69.1% | 24.36 | 44.4% |
| Rubicon Technology Inc (RBCN) | 12 | 9.16 | -23.7% | 5.77 | -51.9% | |
| Sun Healthcare Group Inc (SUNH) | 4 purchases for a total of around US$60,000 | 4.47 | 8.44 | 88.8% | 8.5 | 90.2% |
| Tower Group Inc (TWGP) | 3 sells of US$330,000 and a purchase of US$20,000 | 23.41 | 18.82 | -19.6% | 19.79 | -15.5% |
| -2.4% | -9.7% | |||||
If we consider Zweig’s factor of insider transactions then six stocks had sells but no buys and if these are ruled out from investment then ten shares are left. These shares after six months lost -6% and after a year -12% which is even worse than if the shares with insider transaction sells had not been taken out. If only insider transaction sells of at least $5 million are removed then for the 13 remaining companies after six months there was a -2.4% decline and after a year a -9.8% fall which is still a worse result than if all these insider sell transactions had been left in.
The Google Stock Screener
The Google Stock Screener has 68 factors that can be screened. The resulting company name can be clicked on and will open the respective quote page on Google Finance. It can be used for 20 countries including the USA. (The Google Stock Screener has now gone and Google Finance is just a shadow of its former self.)
To simulate a Zweig Screen:
Market Cap greater than $50 million
5 year Revenue Growth rate greater than or equal to 20
5 year EPS Growth rate greater than or equal to 20
52 week Price Change (%) greater than 1%
P/E greater than or equal to 5 and less than or equal to 15
13 week Price Change (%) greater than or equal to 5%
 |
 |
| The Google Stock Screener Matches | Feb-21-12 | Aug-20-12 | % change | Feb-20-13 | % change | |
|---|---|---|---|---|---|---|
| Notes | Companies that appear in more than one screen have a red font | |||||
| Companies that were acquired in the time period have a blue font | ||||||
| EasyLink Services International Corp. (ESIC) was taken over on Jul, 2 2012 by OpenText Corporation | ||||||
| Amtrust Financial Services, Inc. (AFSI) | 27.44 | 29.62 | 7.9% | 33.68 | 22.7% | |
| Apple Inc. (AAPL) | 1 sell of US$5 million | 514.85 | 665.15 | 29.2% | 448.85 | -12.8% |
| Consumer Discretionary SPDR (ETF) (XLY) | 42.96 | 45.24 | 5.3% | 50.35 | 17.2% | |
| EZCORP Inc (EZPW) | 30.94 | 22.92 | -25.9% | 21.86 | -29.3% | |
| EasyLink Services International Corp. (ESIC) | 3 sells of US$160,650 | 4.69 | 7.25 | 54.6% | 7.25 | 54.6% |
| Main Street Capital Corporation (MAIN) | 23.52 | 27.47 | 16.8% | 32.06 | 36.3% | |
| SL Green Realty Corp (SLG) | 75.22 | 80.81 | 7.4% | 82.16 | 9.2% | |
| Titan Machinery Inc. (TITN) | 2 sells of US$14 million in total | 27.66 | 26.93 | -2.6% | 29.32 | 6.0% |
| Triumph Group Inc (TGI) | 4 sells of US$15 million in total | 64.91 | 63.22 | -2.6% | 73.8 | 13.7% |
| Valmont Industries, Inc. (VMI) | 4 sells of US$47 million | 113.87 | 129.46 | 13.7% | 154.42 | 35.6% |
| Vanguard Growth ETF (VUG) | 68.33 | 71.56 | 4.7% | 74.75 | 9.4% | |
| Vanguard Health Care ETF (VHT) | 64.18 | 69.83 | 8.8% | 77.87 | 21.3% | |
| iShares Morningstar Large Growth (ETF) (JKE) | 73.36 | 78.08 | 6.4% | 79.31 | 8.1% | |
| 9.5% | 14.8% | |||||
The Google screen produced 13 matches but four of these were ETFs. Six of the stocks were also found by at least one of the other stock screeners. Over six months an equal amount invested in all of these shares would have given 9.5% and after a year 14.8%. This compares favorably with the S&P 500 which increased 4.1% over six months and 11% after a year. These results are the second best of all the screeners.
| The Google Stock Screener Matches with only sells removed | Feb-21-12 | Aug-20-12 | % change | Feb-20-13 | % change | |
|---|---|---|---|---|---|---|
| Notes | Companies that appear in more than one screen have a red font | |||||
| Amtrust Financial Services, Inc. (AFSI) | 27.44 | 29.62 | 7.9% | 33.68 | 22.7% | |
| Consumer Discretionary SPDR (ETF) (XLY) | 42.96 | 45.24 | 5.3% | 50.35 | 17.2% | |
| EZCORP Inc (EZPW) | 30.94 | 22.92 | -25.9% | 21.86 | -29.3% | |
| Main Street Capital Corporation (MAIN) | 23.52 | 27.47 | 16.8% | 32.06 | 36.3% | |
| SL Green Realty Corp (SLG) | 75.22 | 80.81 | 7.4% | 82.16 | 9.2% | |
| Vanguard Growth ETF (VUG) | 68.33 | 71.56 | 4.7% | 74.75 | 9.4% | |
| Vanguard Health Care ETF (VHT) | 64.18 | 69.83 | 8.8% | 77.87 | 21.3% | |
| iShares Morningstar Large Growth (ETF) (JKE) | 73.36 | 78.08 | 6.4% | 79.31 | 8.1% | |
| 3.9% | 11.9% | |||||
| The Google Stock Screener Matches with sells over $5 million removed | Feb-21-12 | Aug-20-12 | % change | Feb-20-13 | % change | |
|---|---|---|---|---|---|---|
| Notes | Companies that appear in more than one screen have a red font | |||||
| Companies that were acquired in the time period have a blue font | ||||||
| EasyLink Services International Corp. (ESIC) was taken over on Jul, 2 2012 by OpenText Corporation | ||||||
| Amtrust Financial Services, Inc. (AFSI) | 27.44 | 29.62 | 7.9% | 33.68 | 22.7% | |
| Consumer Discretionary SPDR (ETF) (XLY) | 42.96 | 45.24 | 5.3% | 50.35 | 17.2% | |
| EZCORP Inc (EZPW) | 30.94 | 22.92 | -25.9% | 21.86 | -29.3% | |
| EasyLink Services International Corp. (ESIC) | 3 sells of US$160,650 | 4.69 | 7.25 | 54.6% | 7.25 | 54.6% |
| Main Street Capital Corporation (MAIN) | 23.52 | 27.47 | 16.8% | 32.06 | 36.3% | |
| SL Green Realty Corp (SLG) | 75.22 | 80.81 | 7.4% | 82.16 | 9.2% | |
| Valmont Industries, Inc. (VMI) | 4 sells of US$47 million | 113.87 | 129.46 | 13.7% | 154.42 | 35.6% |
| Vanguard Growth ETF (VUG) | 68.33 | 71.56 | 4.7% | 74.75 | 9.4% | |
| Vanguard Health Care ETF (VHT) | 64.18 | 69.83 | 8.8% | 77.87 | 21.3% | |
| iShares Morningstar Large Growth (ETF) (JKE) | 73.36 | 78.08 | 6.4% | 79.31 | 8.1% | |
| 10.0% | 18.5% | |||||
If companies that had insider transaction sells are removed but not purchases and sells then the remaining eight companies would have a gain of 3.9% after six months and 11.9% after a year. This is worse than if the insider sell transactions were left in the group. If only insider transaction sells of at least $5 million are removed then after six months the portfolio of ten companies would have increased 10% and after a year by 18.5%. This is better than if all the insider sell transactions had been left in the group.
The Financial Times Global Equity Screener
The Financial Times Global Equity Screener is on the website of the British Financial Times. It covers all the main global exchanges not just the three in the US. It is free to use and you can save your screens but you do have to register. It is also free to register and you are sent only one email asking you to subscribe to the newspaper at a reduced rate. There is a Zweig style screen in the default screens but one was created to match the methodology used in the other screens. You can click on the company name and look at the data and news the FT has on this share. Intially the screen sets the countries and sectors to be screened upon and then there are 49 factors to form the screen, most of which are fundamental in nature. There is a nice feature of been able to set short selling activity as a factor. However, price action is very basic and is limited to just being able to detect a positive price movement over the last 52 weeks by a set percentage amount.
To simulate a Zweig Screen:
Regional Focus - USA
DX Short Selling Activity is Low
52 Week Price Change (%) greater than 1%
Revenue Growth (5 Year) greater than or equal to 20
EPS Growth Rate (5 Year) greater than or equal to 20
P/E Ratio greater than or equal to 5 and less than or equal to 15
 |
 |
| The Financial Times Global Equity Screener Matches | Feb-21-12 | Aug-20-12 | % change | Feb-20-13 | % change | |
|---|---|---|---|---|---|---|
| Notes | Companies that appear in more than one screen have a red font | |||||
| Companies that were acquired in the time period have a blue font | ||||||
| Access Plans Inc (APNC) was taken over on May 30, 2012 by Aon Affinity | ||||||
| EasyLink Services International Corp. (ESIC) was taken over on Jul, 2 2012 by OpenText Corporation | ||||||
| Transcend Services Inc (TRCR) was taken over on Apr 26, 2012 by Nuance Communications Inc | ||||||
| Access Plans Inc (APNC) | 2.75 | 3.28 | 19.3% | 3.28 | 19.3% | |
| Apple Inc (AAPL) | 1 sell of US$5 million | 514.85 | 665.15 | 29.2% | 448.85 | -12.8% |
| BofI Holding Inc (BOFI) | 15 sells of US$3.6 million | 16.73 | 22.94 | 37.1% | 34.87 | 108.4% |
| CF Industries Hldg Inc (CF) | 3 sells of around US$19 million in total | 184.3 | 215.58 | 17.0% | 207.07 | 12.4% |
| EasyLink Services International Corp (ESIC) | 3 sells of US$160,650 | 4.69 | 7.25 | 54.6% | 7.25 | 54.6% |
| EZCORP Inc (EZPW) | 30.94 | 22.92 | -25.9% | 21.86 | -29.3% | |
| Main Street Capital Corp (MAIN) | 7 purchases totalingUS$466,000 | 23.52 | 27.47 | 16.8% | 32.06 | 36.3% |
| Millicom International Cellular SA (MIICF) | 109.64 | 89.27 | -18.6% | 80.9 | -26.2% | |
| Transcend Services Inc (TRCR) | 1 purchase of US$107,000 and 10 sells of US$1.9 million | 22.38 | 29.57 | 32.1% | 29.57 | 32.1% |
| 18.0% | 21.6% | |||||
The FT Global Equity Screener produced nine results and four of these were shared with at least one more stock screener. The matches increased 18% after six months and 21.6% after a year. This compares favorably with the S&P 500 which increased 4.1% over six months and 11% after a year. These are the best results for any screener over these time periods.
The FT Global Equity Screener did extremely well at picking future acquisitions considering its only technical analysis factor was a positive 52 week price change. Some of its strong performance is therefore likely to be due purely to chance.
| The Financial Times Global Equity Screener Matches with only sells removed | Feb-21-12 | Aug-20-12 | % change | Feb-20-13 | % change | |
|---|---|---|---|---|---|---|
| Notes | Companies that appear in more than one screen have a red font | |||||
| Companies that were acquired in the time period have a blue font | ||||||
| Access Plans Inc (APNC) was taken over on May 30, 2012 by Aon Affinity | ||||||
| Transcend Services Inc (TRCR) was taken over on Apr 26, 2012 by Nuance Communications Inc | ||||||
| Access Plans Inc (APNC) | 2.75 | 3.28 | 19.3% | 3.28 | 19.3% | |
| EZCORP Inc (EZPW) | 30.94 | 22.92 | -25.9% | 21.86 | -29.3% | |
| Main Street Capital Corp (MAIN) | 7 purchases totalingUS$466,000 | 23.52 | 27.47 | 16.8% | 32.06 | 36.3% |
| Millicom International Cellular SA (MIICF) | 109.64 | 89.27 | -18.6% | 80.9 | -26.2% | |
| Transcend Services Inc (TRCR) | 1 purchase of US$107,000 and 10 sells of US$1.9 million | 22.38 | 29.57 | 32.1% | 29.57 | 32.1% |
| 4.7% | 6.4% | |||||
| The Financial Times Global Equity Screener Matches with sells over $5 million removed | Feb-21-12 | Aug-20-12 | % change | Feb-20-13 | % change | |
|---|---|---|---|---|---|---|
| Notes | Companies that appear in more than one screen have a red font | |||||
| Companies that were acquired in the time period have a blue font | ||||||
| Access Plans Inc (APNC) was taken over on May 30, 2012 by Aon Affinity | ||||||
| EasyLink Services International Corp. (ESIC) was taken over on Jul, 2 2012 by OpenText Corporation | ||||||
| Transcend Services Inc (TRCR) was taken over on Apr 26, 2012 by Nuance Communications Inc | ||||||
| Access Plans Inc (APNC) | 2.75 | 3.28 | 19.3% | 3.28 | 19.3% | |
| BofI Holding Inc (BOFI) | 15 sells of US$3.6 million | 16.73 | 22.94 | 37.1% | 34.87 | 108.4% |
| EasyLink Services International Corp (ESIC) | 3 sells of US$160,650 | 4.69 | 7.25 | 54.6% | 7.25 | 54.6% |
| EZCORP Inc (EZPW) | 30.94 | 22.92 | -25.9% | 21.86 | -29.3% | |
| Main Street Capital Corp (MAIN) | 7 purchases totalingUS$466,000 | 23.52 | 27.47 | 16.8% | 32.06 | 36.3% |
| Millicom International Cellular SA (MIICF) | 109.64 | 89.27 | -18.6% | 80.9 | -26.2% | |
| Transcend Services Inc (TRCR) | 1 purchase of US$107,000 and 10 sells of US$1.9 million | 22.38 | 29.57 | 32.1% | 29.57 | 32.1% |
| 16.5% | 27.9% | |||||
If stocks that had insider transaction sells but not purchases and sells are ruled out then the remaining five companies grew in value 4.7% over six months and 6.4% over a year. This is a much worse result than if the insider transaction sells had been left in. If only insider transaction sells of at least $5 million are removed then for the seven remaining companies after six months they increased by 16.5% and after a year by 27.9%. This is slightly worse over six months but better over a year than if all these insider transaction sells had been bought.
The FT Global Equity Screener does show you all the factors that you have asked it to screen upon not just a list of resulting company tickers. The stock screener can give spurious results if you try adding factors such as dividend yield that are not searched upon.
In the summer of 2012 the FT Global Equity Screener started to give totally false results and the number of matched results this screener said it had found was different from the number actually shown. The screener by early 2013 seems to be giving accurate results once again. The Financial Times in early 2013 was in the process of revamping its website.
Review of Free Stock Screeners Part 3