
VectorVest 7 Trading Software Review
VectorVest7 is a software package that creates and runs a trend trading strategy but has educational support at extra cost. The VectorVest methodology stresses trading technique and is not just a stock screener that picks stocks. It is based mainly on moving averages but can also employ fundamental factors such as its own valuation metric. The base strategy can be modified to cater for swing traders and income investors. VectorVest7 covers the USA, Canada, UK, Europe, and Australia. You get trade information on all these countries with a single subscription. It is a desktop software solution with the data updated online rather than being purely web-based which should make it more reliable. FactSet provides the underlying data used for the trading algorithms. Part of the subscription is a daily commentary on which way markets are trending and if you should trade. The company also provides live online training courses on how to go about trading for an extra fee, which will be a great help to beginners. Some of the equations and strategies used are proprietary but the basic idea behind the trading system will be familiar to all traders. The company has provided trading software for over 30 years so it has a long track record.
Dr Bart DiLiddo founded the company in 1988 and initially offered a weekly printed newsletter, and then offered a software product first on floppy disks, then CD and finally the current cloud-based system. Dr DiLiddo received a chemical engineering degree in 1960, which required extensive knowledge of advanced mathematics. Whilst working at a research lab in Brecksville, Ohio he became interested in the stock market and applied his mathematical knowledge to technically trade the market. Dr DiLiddo then combined technical factors with a fundamental valuation system and factors to determine a stock’s safety and volatility. His book Stocks, Strategies and Common Sense (1995) explain his stock picking and trading philosophy behind the software. (You get a free pdf copy with your trial.)

VectorVest will create a strategy that has three parts; when to buy, what to buy and when to sell. The trading system mainly uses moving averages to spot market entry or exit points for both stocks and markets. VectorVest analyzes over 23,000 stocks every day for value, Safety and Timing. It unifies these factors into a comprehensive indicator called the ‘VST-Vector’. Stocks with the highest VST-Vector ratings have the best combinations of Value, Safety, and Timing. VectorVest is geared up for use with a trend-following strategy, although it can also be used for swing trading. The equations used to analyze the stocks are propriety and are not used by anybody else. So if you start using the VectorVest trading system your ability to analyze stocks will not directly translate to another system.
Below I have described the maths the VectorVest system uses to analyze a share. You do not need to know this or even understand it, in order to successfully use the system.
VectorVest uses an equation devised to value bonds but has been converted to value shares using the Price to Earnings ratio.
Bond Price = 100*(IP/IY)
IP = Annual Interest Payment in $
IY = Interest Yield in Percent
The Earnings Yield of a stock may be obtained from its P/E Ratio as follows:
EY = 100*[1/(P/E)]
Where EY = Earnings Yield in Percent P = Stock Price in $/Share E = Earnings Per Share in $/Share
The VectorVest Quick Value Estimate is
V = 100 x [E/(IY + YP)]
The key measure of operating performance is the return on capital employed. VectorVest measures profitability by using Return on Total Capital, (ROTC). (Total Capital is defined as equity plus long-term debt.) If a company’s ROTC is higher than the IY+YP, then its stock’s value should go up.
VectorVest has found that the effect of profitability is non-linear and reflects reality as shown in the following equations:
Adjusting stock value for profitability:
V = 100*(E/(IY+YP))*SQR[((R+G)/2)/((IY+YP)+F)]
Where V = Stock Value in $/Share E = Earnings Per Share in $/Share IY+YP = Interest Yield + Yield Premium SQR = Square Root R = Profitability Factor G = Annual Earnings Growth Rate in %/yr. F = Inflation Rate in %/yr.
The factor, SQR[((R+G)/2)/((IY+YP)+F)], is a performance measure of the company’s ability to increase shareholder value. If this factor is less than 1.00, the company is losing out to interest and inflation and should be viewed as a questionable investment prospect.
Most fundamental analysts do not use discounted cash flow because it is useless as a practical investment methodology as it is impossible to predict profits. Instead, they tend to use a stock’s current earnings to its current stock price as a rough yardstick to measure value. Valuation methods by individual investors have become increasingly sophisticated and include Joel Greenblatt’s use of return on capital, which he defines as operating profit (EBIT or earnings before interest and taxes) divided by tangible investment capital (net working capital plus net fixed assets) and James O'Shaughnessy composite valuation methods that use several valuation ratios which are composited together.
The VectorVest valuation system does not use profitability, which cannot be predicted but a more sophisticated version of the P/E ratio and Return on Total Capital. It will only find a narrow set of companies as a lot of companies will simply not have all the necessary figures in their financial report and so will be ignored by the valuation system. It, therefore, chooses shares from a single narrow point of view. It tends to find a small number of shares. About half the shares it found were familiar to me and were also found in other fundamental screens. Having said that I think it works well at finding cheap growth-orientated shares. You do not have to use it as some VectorVest traders stick to purely technical factors when they screen for stocks. However, the number of technical indicators has been limited to the most popular ones used by VectorVest users. The limited number of technical factors made it much easier for VectorVest to implement the important back tester feature.
The Dashboard is the main interface for VectorVest 7 and is configurable. You can move boxes or gadgets into a more suitable position for the user. The top bar has links to all the main functions. By default, various market information is displayed including the progress of the Vector Vest Composite is a broad index of all the shares and funds covered by VectorVest in that region. The top shares in a model portfolio are displayed on the left side. In the center of the screen is the Market Timing Gauge telling you if market conditions for the trading strategy allow you to buy today. Further down Color Guard tells you the market conditions over the past couple of days. On the right and at the bottom are links to view tutorials or you can sign up for various pay-for online coach sessions with a live tutor.
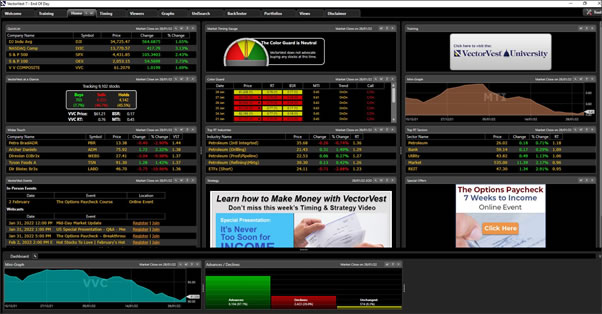
The Market Timing Gauge and Color Guard are backed by daily or weekly advisories and give the trader signals when they can buy in the market. These are proprietary to VectorVest and contrary to the view of most traders who will buy in any market condition if they believe the stock is breaking out or will continue to trade up or believe they are in a dip and the current low price is a fleeting opportunity. The advantage for novice investors is that it will keep them from making expensive mistakes in turbulent markets. Moving averages do not work well in a market that is not clearly trending up and the shares that rally the most at the first turn market turn, may not be the shares that continue to trend up. VectorVest says you should wait until they detect a clear trend.

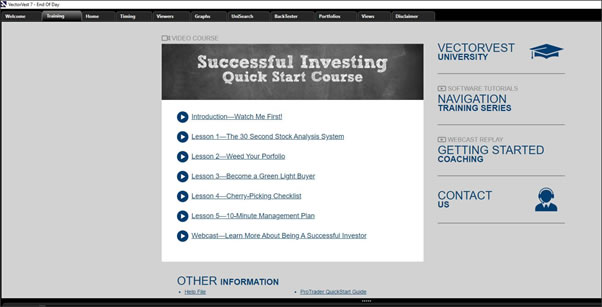
VectorVest starts you off with some introductory videos and tasks to do. These are on YouTube and are professionally created and informative. Introductory videos are available for other parts of the software such as the BackTester and are equally professionally produced and informative. The follow-up is a series of 14 roughly hour-long videos called the Navigation Training series, which were originally a live online teaching course from some years ago. They sometimes lack specific instructions such as click here to do this but are far better than what most fundamental stock screeners provide to support their products.
Setting up a Trading System
VectorVest gives a portfolio of potential stocks to buy and then gives buy and sell signals to trade these stocks. Money management elements such as the number of positions to hold are included in the system and its validity can-be-checked using the BackTester facility. The trader is also meant to follow market-timing signals from the Color Guard and Market Timing Indicator (MTI) that can veto you buying any stocks on signaled days.
This screen shows the trading rules for this portfolio both long and short. It lists a set Fill mode or stock buying rules and stop rules to exit a trade. It includes the number of positions to hold, a profit locker is in operation so that at 50% profit a position is closed. For positions automatically closed, you cannot repurchase this same stock for 21 days.

For individual stocks, the system can use various technical signals such as moving averages, Bollinger bands or MACD to determine the trend direction and if a buy, hold or sell signal is given in the portfolio. There is a choice of ready-created different stop and buy signals to choose from. Its trading system includes timing for entry and exit and what time-frame you will trade. The system includes calculating the planned trading size for the portfolio. Its back-testing will give a probability of success and model portfolios give past performance and an idea of reward vs risk.

In the Viewer, you can pick Trading System Viewer to see model portfolios and other ready-made trading systems with information on how well they have done in the past. A VectorVest trading system has 3 parts. A screen that finds suitable stocks to buy. Graphs that show the turning points to buy then sell and the trading rules that govern other aspects of buying and selling such as risk. The screen below shows a portfolio with the shares inside and a graph of their performance.
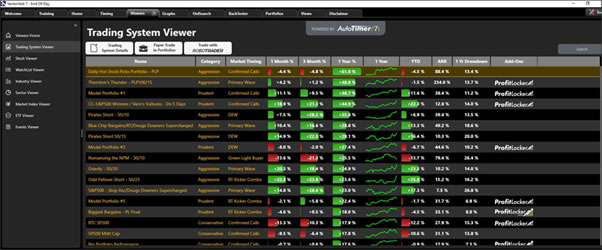
There are a number of model portfolios to choose from with their recent performance. You can also modify one or completely create your own from scratch. The screen below shows Model Portfolio One with a graph of its performance and its current shares in its portfolio. These could be considered a watch list and you buy the shares that are flagged a buy and have the most desirable fundamental and technical factors. You can sort on any of these factors such as the VST (Value, Safety, Timing). The RT (Relative Timing) tells you. There is a brief description of its rules, which are that it is a long strategy but hedged with shorts in a down period.

Creating your own search rules is done in Unisearch. It is a stock search tool using both fundamental and technical factors. It divides investment styles using risk into prudent, conservative, aggressive, or speculative. (There are a number of ready-made strategies based on these types in folders on the left-hand side. Each screen will show all the technical and fundamental factors used to form it.) You can filter the resulting portfolio by VectorVest fields to find shares with the most advantageous characteristics. The addition and subtraction of operators are used for sorting indicators on the same scale. For CI (Comfort Index) and RV (Relative Value) stocks, you can do CI+RV as they are on the 0-2 scale. For CI and RV and Value you use multiply as the value is not on the 0-2 scale. Even these advanced sorts are relatively easy to do.
The screen below shows the technical and fundamental rules used to find shares to trade. They include Stock GRT - (Growth Rate) >= 1.4 This is a fundamental VectorVest factor that allows you to choose stocks with a high growth rate. The system includes a few fundamental factors but these are a fraction of what you would find in a fundamental Screener. The screen sets other factors such as its VectorVest Relative Safety score, a stock price over $1 to rule out very volatile shares, Stock 50-day moving average industry group and stock exchange.

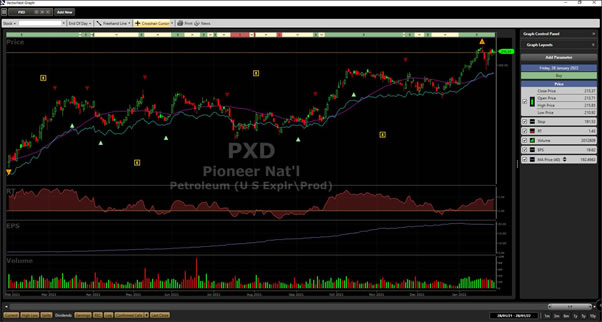
This graph shows a stock that came out of the search. The line graph shows a moving average and volume potential optimum entry points for the VectorVest System marked on it. You can choose from a large number of buy and sell signals that can be slow or fast. The green and red triangles match the green and red entry/exit signals on the Recommendation column of the portfolio sheet. The displayed stop line is a 13-week moving average which if crossed gives a strong warning to sell. Triangles with an H or L mark Highs and Lows.
An example of a possible buy rule using standard and exponential moving averages is:
Price is above the 50 d M.A.
5-E.M.A > 8-E.M.A and 8-E.M.A. > 13 – E.M.A.
RT is trending higher
Example sell rules are:
5-E.M.A. closes below both the 8-E.M.A. and 13-E.M.A.
BackTester
BackTester is potentially an extremely powerful feature that allows you to develop your own strategy or tweak an existing one with some certainty it will work. BackTester is used to test and check the efficacy of a strategy and helps to refine money management. AutoTimer allows the use of all the different VectorVest market time calls. It is an extra pay for module with a large one-time fee. However, you can manually test back-tests without AutoTimer and they have a video on how to do this. You test from a buy to a sell signal and get the results of how the shares would have performed in this past period for the number of shares in the portfolio with a positive gain and the per cent gain for all of them over this period.
VectorVest does have competitions for the best strategy, which uses BackTester. These look like a lot of fun. However, I have seen BackTester used to say that one strategy is better than another when in fact there was so little difference between them and the result was probably down to just luck and was certainly not scientifically statistically significant. Most of the time market conditions will be the same as three months ago and what worked then will still work now. However, there are turning points when market conditions completely change and in this case it might be wise either rethink your strategy based on what is likely to work in the future or wait and see what starts to trend upward.
Add-ons
AutoTimer is also required to get Vector Vest to handle closing positions when a stop is triggered. Pro Trader 7 is a special add-on module that allows the cross-over of moving-averages to be used for buy and sell signals. It is available for a large one-off fee.
Robotrader allows you to completely automate your trading. (Because of UK regulations, it is not available in the UK.)
RealTimeDerby is for day trading and swing trading. Watchdog gives an alert when a stock hits a specific criteria. This tool comes free with RealTimeDerby but not with end of day. It is probably the most useful add-on.
OptionsPro and OptionsAnalyser, which is available for a one-off fee, make the trading system available for options traders.
Vectorvex University
Vectorvex University offers various courses on using the software and how to trade. Some are free, whilst others are charged for.
I sat in on the online Trading coaching sessions and the staff are very knowledgeable about trading and technical analysis and explain what the system is saying about what is going on with a customer’s trade. If you are fairly inexperienced trader, I would advise you not to join these coaching sessions until you have learnt how to use the software and have some experience of using the trading system for some months even though it is discounted when you first start.
The courses are on the expensive side even when discounted but are far from over the top compared with some trading courses. If you are out of the US, then the regional staff may will provide their own insights. I also watched Britain’s David Paul Q&A sessions and he is a very knowledgeable and experienced trader who gives a weekly webcast at no extra charge that goes through what is going on in the markets and with his own portfolio, which will give customers insights and ideas. I noticed that customers from other regions attended his talk.
You should evaluate the trading system yourself with a low-cost trial. Support for the product is strong and includes a free telephone support number that can be used globally.
Conclusion
In conclusion, VectorVest is a serious trading strategy tool that works even for novice users. It is certainly not some get-rich scheme that will only benefit the people putting on the course. (Many of the users of VectorVest will spontaneously tell you that the system works without any prompting from the company.) It is probably best for less experienced traders, as the proprietary analysis will be more suitable for them, as they will not have learned anything different. VectorVest’s hope is to grab and keep these inexperienced traders. The proprietary analysis of valuing growth shares might put off some experienced traders used to more conventional fundamental methodologies or lesser-known technical techniques but they still could get a lot out of the system.