
How to do a James P. O'Shaughnessy Trending Value Screen
Investstrat first created an O'Shaughnessy Trending value screen using the Stockopedia screening service and then became aware that the ValueSignals service has a readymade Trending Value template and has recreated O'Shaughnessy’s Value Factor Two composite ranking. (The ValueStockScreener is now known as ValueSignals.) This is a revised version as Stockopedia has changed the presentation of their screener and the search criteria have been lowered to give more shares.
Creating a Trending Value Screen using Stockopedia.
The Stockopedia screening service has created composite rankings that are in part inspired by the O'Shaughnessy Value Factor Two and allows a screen to be formulated that is very close to O'Shaughnessy original. Both screening services are affordable to individual Investors and do not involve ranking hundreds of shares by hand. (Scoring systems are commonly used by institutional investors and similar systems are by S&P, Starmine and Soc Gen, with Benjamin Graham being the first to devise a value scoring screen.)
The Trending Vale Screen looks for companies with both a high level of value and momentum. The composite value method means that the shares found will not just be traditional deep value shares with a low price-to-book but shares that are lowly valued by an array of measures. Screened shares are likely to be value shares in recovery or small, unknown companies with high growth.
Trending Value Screen
- Be a member of the All Stocks Universe.
- Be in decile 1 of the composited Value Factor two. (The 10% of stocks with best valuation scores across the six value factors that form O'Shaughnessy's composited value rank.)
- Buy the 25 and 50 stocks with the best six-month price appreciation.
O'Shaughnessy Value Composite Two is formed by ranking the following factors: -
- Price-to-Book
- Price-to-Earnings
- Price-to-Sales
- EBITDA/EV
- Price-to-Cash Flow
- Shareholder Yield
Stockopedia has a value rank formed from: -
- Price-to-Book Value
- Price-to-Earnings
- Price-to-Free Cash Flow
- Dividend Yield %
- Price-to-Sales
- Earnings Yield %
The differences are that Shareholder Yield is formed from Dividend Yield and Buyback Yield and the latter factor is missing from the Stockopedia Value Rank. Earnings Yield (EBIT/EV) is also used in the Stockopedia Rank rather than Enterprise Value to Earnings before Interest, Taxes, Depreciation and Amortization (and Exceptionals) (EV/EBITDA). The Stockopedia’s Earnings yield is EBIT/EV (Earnings Before Interest and Tax/Enterprise Value). O'Shaughnessy’s Buyback Yield is the amount of cash expended to repurchase the company's shares in the open market over a year.
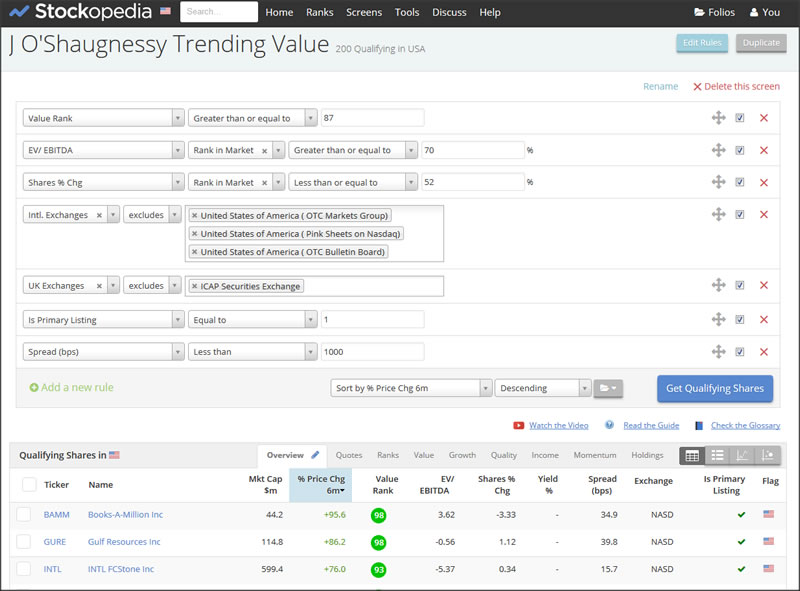
Stockopedia Trending Value Screen
Value Rank greater than or equal to 87
EV/EBITDA Rank in Market greater than or equal to 70
Shares % Change Rank in the Market less than or equal to 52
Spread (bps) less than 1000
Intl. Exchanges excludes United States of America (OTC Markets Group), United States of America (Pink Sheets on NASDAQ), United States of America (OTC Markets Board)
UK Exchanges excludes ICAP Securities Exchange
Is Primary Listing is Equal to 1
Sort by Price Change 6m Descending
As there are differences between these value ranks there are a few additions to make the Stockopedia value rank more similar to O'Shaughnessy’s Value Composite Two. The first thing to do is to set the Value Rank for the top 10% and I have used greater than or equal to 87 rather than greater than 91. The Stockopedia rank is of the entire market universe but O'Shaughnessy study did not have data for the small OTC markets so these will be removed to better match his results. This means that greater than 90 will give much less than top decile and to put some of these shares back in, the cutoff point has been lowered to 87. You should also be aware that there is a hidden decimal place so if you wanted to do greater than 90 then value ranks of 90 will occur as 90.5 is greater than 90 but it will appear as 90.
It is also necessary to add in the EV/EBITDA rank and the obvious thing would be to set it at greater than ninety one. However, the value rank covers a large number of different factors and a company with a high ranking in a number of these but relatively low in just one can still make the grade. To allow for this I suggest the use of a much lower EV/EBITDA rank of greater than or equal to 70 as this cuts out the worst companies valued by EV/EBITDA and it will also contain the best companies. You could toughen it up to greater than or equal to 75 if a lot of results are returned.
The next process is to rank companies that buy back their own shares which is part of O’Shaughnessy Shareholder Yield. Dividend Yield is already in the Stockopedia value rank, so again the ranking should allow some leeway to allow companies that have a high yield but do not buy their shares the opportunity to come through. To formulate this use a rank of Diluted Weighted Average Shares, percentage of the year on year change (Shares % Ch) set at less than or equal to 52. The share with the worst company for stock issues was around 2.1% in the top twenty for the US market using the ValueSignals and the worst share given by using Shares % Ch less than or equal to 52 using this Stockopedia based screen was 1.65%.
O’Shaughnessy only considered a one year period in his rank but Stockopedia has similar criteria for three and five years which would take into account share buybacks over a longer period of time and not just the last year and so remove unusual blips but using them is likely to reduce the number of results. Try different figures in the Shares % change rank if more or less results than wanted are received.
An alternative would be to use Shares % Change set to less than to equal a relatively small number (2.0 or 1.75, 1.5, 1, 0.5, 0). These alternative figures will give increasingly fewer results but with a higher level of share buy backs. However, companies that would have made it into the results using ranking criteria which are weak on share buybacks but have much stronger data in other parts of the value rank would be cut out. The results may contain companies with no data for buy backs and this is probably fine as most of these companies will probably have had no share buybacks and also have not been involved in equity dilution either. If you are not happy with these results, rule them out by hand.
O'Shaughnessy All stock Universe was devised to be statistically testable over long historical periods of time and as such contains the primary listings on the NYSE, Nasdaq and Amex exchanges. It may be wise to remove companies trading on some minor exchanges such as Over the Counter (OTC) and the Pink Sheets if you are unhappy about investing in possibly illiquid shares or higher risk shares. It is hard to believe that an OTC share up 800% over the last six months will continue such a performance. O'Shaughnessy's stock screen has not been tested on these markets. If the Trending Value stock screen is to be used on the exchanges of other countries it would also be wise to remove minor, illiquid 'over the counter' type exchanges. O'Shaughnessy has used Spread (bps) less than 1000 in some of his other screens to remove illiquid shares.
For the UK, this stock screen should not be used with the ICAP Securities Exchange. (The Primary Listing criteria has now been removed.) It is more debatable if the Aim Market should be excluded but it would be wise to give shares selected from this exchange an extra level of scrutiny.
The results are then sorted by Price Change over six months (% Price Chg 6m) in descending order. O’Shaughnessy’s portfolio is formed from either the top 25 or 50 companies the screen generates.
There are still differences with O'Shaughnessy’s Value Composite Two and it is not scientifically possible to formulate it by combining three different ranks but it captures the spirit of the screen and comes very close to it without using expensive professional databases and also without considerable hard work. The value rank includes Earnings Yield (EBIT/EV) which is not in O'Shaughnessy’s Value Composite Two, but although purists may be displeased, it gives the value rank a broader view of value. Compared to the ValueSignals it cuts out a number of outliers that produce from the Trending Value Rank, however all the shares produced are strong all round value shares. Stockopedia intends to change its ranking system during 2016 which may make this screen much more of an O'Shaughnessy Trending Value 'style' screen.
Differences between using Stockopedia and the ValueSignals to do Trending Value
A comparison of the two services for the US stock market reveals that the screen described above using Stockopedia found 200 stocks of which 87 had positive prices gains over the last six months. Whilst, the ValueSignals found 288 stocks with 108 having a positive price change over the last six months using search parameters that included a Results Date Filter of six months, removal of OTC Stock Markets and a Daily Trading Value of $80,000 over the last six months to remove illiquid shares. About 30% of the results with a positive price gain that were found using Stockopedia also appeared in the ValueSignals. The screens were run on the same day in May 2015, with the OTC exchange exclusions to match O'Shaughnessy’s data and to replicate his results.
The difference between the two screeners is due to lots of little variances in the methodology of the screeners. These differences then build up and compound. The ValueSignals uses data from S&P Capital IQ with trailing twelve month (TTM) quarterly and yearly data been updated once a week, whilst stock quotes are updated twice a week, whilst Stockopedia uses data from Thomson Reuters and is updated daily. (Most US companies only make a full report once a year, with extra quarterly updates. In Emerging Markets you may be lucky to get even an annual update.) Stockopedia uses Reuter’s methodology to standardize the earnings per share data and create the timeliest set of ratios based on TTM data so that earnings per share figures can be different from the reported figures in the accounts which could be considered too optimistic and other methodologies to create these figures. Such differences in methodology will mean that some of company figures to create the value ranks will be different. The Stockopedia Value Rank is also different from O'Shaughnessy’s Value Factor Two. The result of all these differences is that at this stage of the stock ranking, some companies in the top 10 decile for the ValueSignals are in the top 20 or 30 decile or worse for Stockopedia.
The year on year change in a firm's diluted weighted average shares is part of shareholder yield, but is not something you can search upon or is a factor in the results of the ValueSignals. The results of the screen from the ValueSignals had the Value Rank and the Shares % Chg looked up using Stockopedia. The results confirmed that the ValueSignals does take company buy backs into account with its Trending Value screen. The best stock for company share buy backs had a result of -18.4% for Shares % Chg but its Stockopedia Value Rank was only 48. The stock with the worst level of new stock issues had a Shares % Chg of 2.08% with a value rank of 73. (Stockopedia did not have an EV/EBITDA figure but it is likely that ValueSignals listed it as having a high EV/EBITDA value figure.) Neither share would have made it into the results of the Trending Value screen using Stockopedia as the worst share must have a minimum Value Rank of 87 and the worst result of Shares % Chg at 52 was under 1.65%. The Trending value screen using Stockopedia is cutting out outliers with extreme value in one area and it also has a disagreement with the ValueSignals as to what are value shares.
The Stockopedia Value Rank is set to rank all companies in the market, so removing the OTC exchanges will result in much fewer shares found. However, the ValueSignals will rank the shares left in the dataset dynamically and give the top decile after some categories of share are removed such as OTC.
Another difference occurs when the results are ranked by price change over six months. The Stockopedia price data is updated daily so does this for you, whilst the value rank screener is updated twice weekly, as price data is normally just not that important to value investors so the order is likely to be slightly out of date. (The ValueSignals should be up-to-date on Mondays and Wednesdays. If you must have the most up-to-date data or see the price change over six months, then free historical price data is available on Goggle and Yahoo Finance and the screen results can be easily converted into Excel to calculate the most up to date order possible.)
A large number of Chinese companies that may or may not be in the too good to be true category were found in the Stockopedia results but relatively few in the ValueSignals results. The ValueSignals used to classify companies based on 'country of incorporation' but this was recently changed to country of the market where the company has its primary listing. This may mean that more of these shares will appear in the screens results in the future. At first sight this contravenes O'Shaughnessy screen but his long term data set would not have included very many companies of this type. Stockopedia’s Paul Scott who writes a small company column, strongly suggests that such companies should not be invested in. Usually you can spot these companies just by their name, but you may need to do a little bit of research about each company using the Stockopedia company page or search on Goggle or Yahoo Finance and decide if you want to rule these companies out. (Not all such companies are just on OTC exchanges.)
Using the ValueSignals and Stockopedia to do Trending Value
Both Stockopedia and the ValueSignals allow the investor to remove OTC exchanges from US searches that were not in O'Shaughnessy’s data and results. The suspicion has to be that such small and illiquid stock results will behave differently from O'Shaughnessy's. For other exchanges it may be wise to set criteria to remove such small and illiquid type OTC companies whilst using both screeners.
There is no point in screening for shares if you cannot purchase them through your broker because they are too small or illiquid and you should adapt your screening strategy to meet this requirement. The ValueSignals can be used to search a number of countries whose stock exchanges could be described as emerging markets. Stockopedia can search a number of countries in Europe such as Greece and other Eastern European countries that could be placed in this category. For these countries it would be wise to change the nature of the screen away from trying to find fast growing and relatively unknown microcaps and large companies that are in recovery to more solid but cheap emerging market shares of relatively large size, whose performance is being recognized by its market.
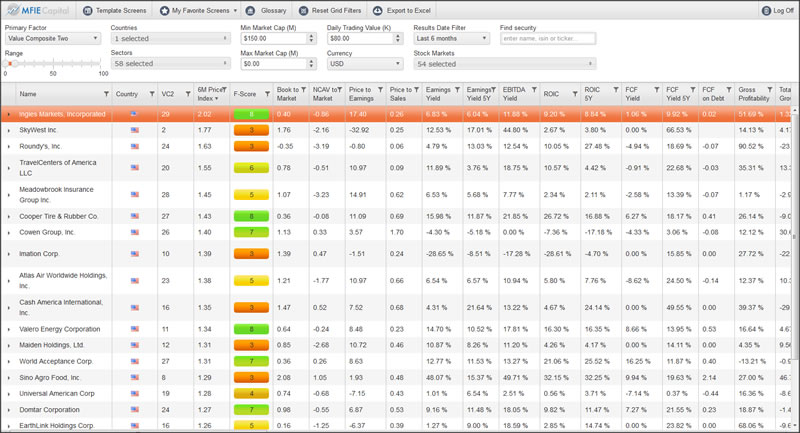
The ValueSignals has filters of Market Cap in millions and a Daily Trading Value in thousands based on the average of the past 6 months. The ValueSignals believes that trading value is better than volume to filter out illiquid stocks. You can set the currency in US dollars, British pound, the European dollar, Japanese Yen and the Australian Dollar. A conversion will be made if you use US dollars to screen the European market for instance. For the US, the Daily Trading Value at $80,000 will remove illiquid shares from the results of the ValueSignals.
US investors who are able to easily invest and monitor small shares in their home market may not want to set a minimum market cap. Foreign investors who cannot easily do these things may want to set the company size at around $500 million which is in the small cap size. When this screen is used on emerging market countries, the investor may find it wise to set the market cap size much higher to over $2 billion which is in the medium company size and also increase the Results Date Filter to a year to take into account slower company reporting. This will change the nature of the stock screen results when compared to stocks found in more developed markets.
The process to do a Trending Value screen using the ValueSignals is simple and straightforward even for beginners. Open, the Trending Value Template then decide which countries are to be screened and if appropriate remove any OTC exchanges for these countries in the Stock Exchange Box. (For the US – untick: Pink otc markets inc. (nqb) and Otc bulletin board - other otc.) Then decide upon what Results Date Filter criteria to use, this will cut out any companies that have not reported in a given period of time. Then set the Minimum Market Cap which may partly depend on what size company your broker will allow you to invest in that country and how illiquid the small company shares are in this market. Finally set the Daily Trading Value as a further check to remove illiquid shares. You can then save the screen as a Favorite and run it whenever you wish.
The ValueSignals also includes the other O'Shaughnessy’s Value Composite Ranks that may be used as alternatives. How to do this is described here.
The Trending Value screen when used with Stockopedia requires the screen to be set up as a user screen as described above, which is slightly more complicated and is a slightly imperfect implementation of O'Shaughnessy’s screen. Stockopedia allows the investor to remove the OTC exchanges for the US and UK but for other exchanges it would be wise to set other factors such as size (Mkt cap either as a currency amount or above a rank of the market) and exclude shares with a poor bid offer spread (Spread bps less than 1000) that will remove illiquid OTC type shares.
Other factors that will remove illiquid shares that available on Stockopedia include using variables such as the number of shares outstanding (Shares Out greater than 5000000) and volume variables (3m Avg Vol greater than 15,000). Stockopedia currently covers the US, UK and the Europe and screens can be set in these region’s currencies and will also convert these currencies if Europe for instance was screened with a market cap set in US dollars.
It has to be stressed that nothing is set in stone and the investor using these stock screeners will have to think about the region, country and exchange to be screened and experiment to find what is the best way to remove illiquid shares and shares on minor OTC exchanges without removing the cheap growth stocks that some of Trending Value's successful results depend upon.
(Please do not invest in any of the results shown as these are merely illustrative and will be way out of date when seen here.)